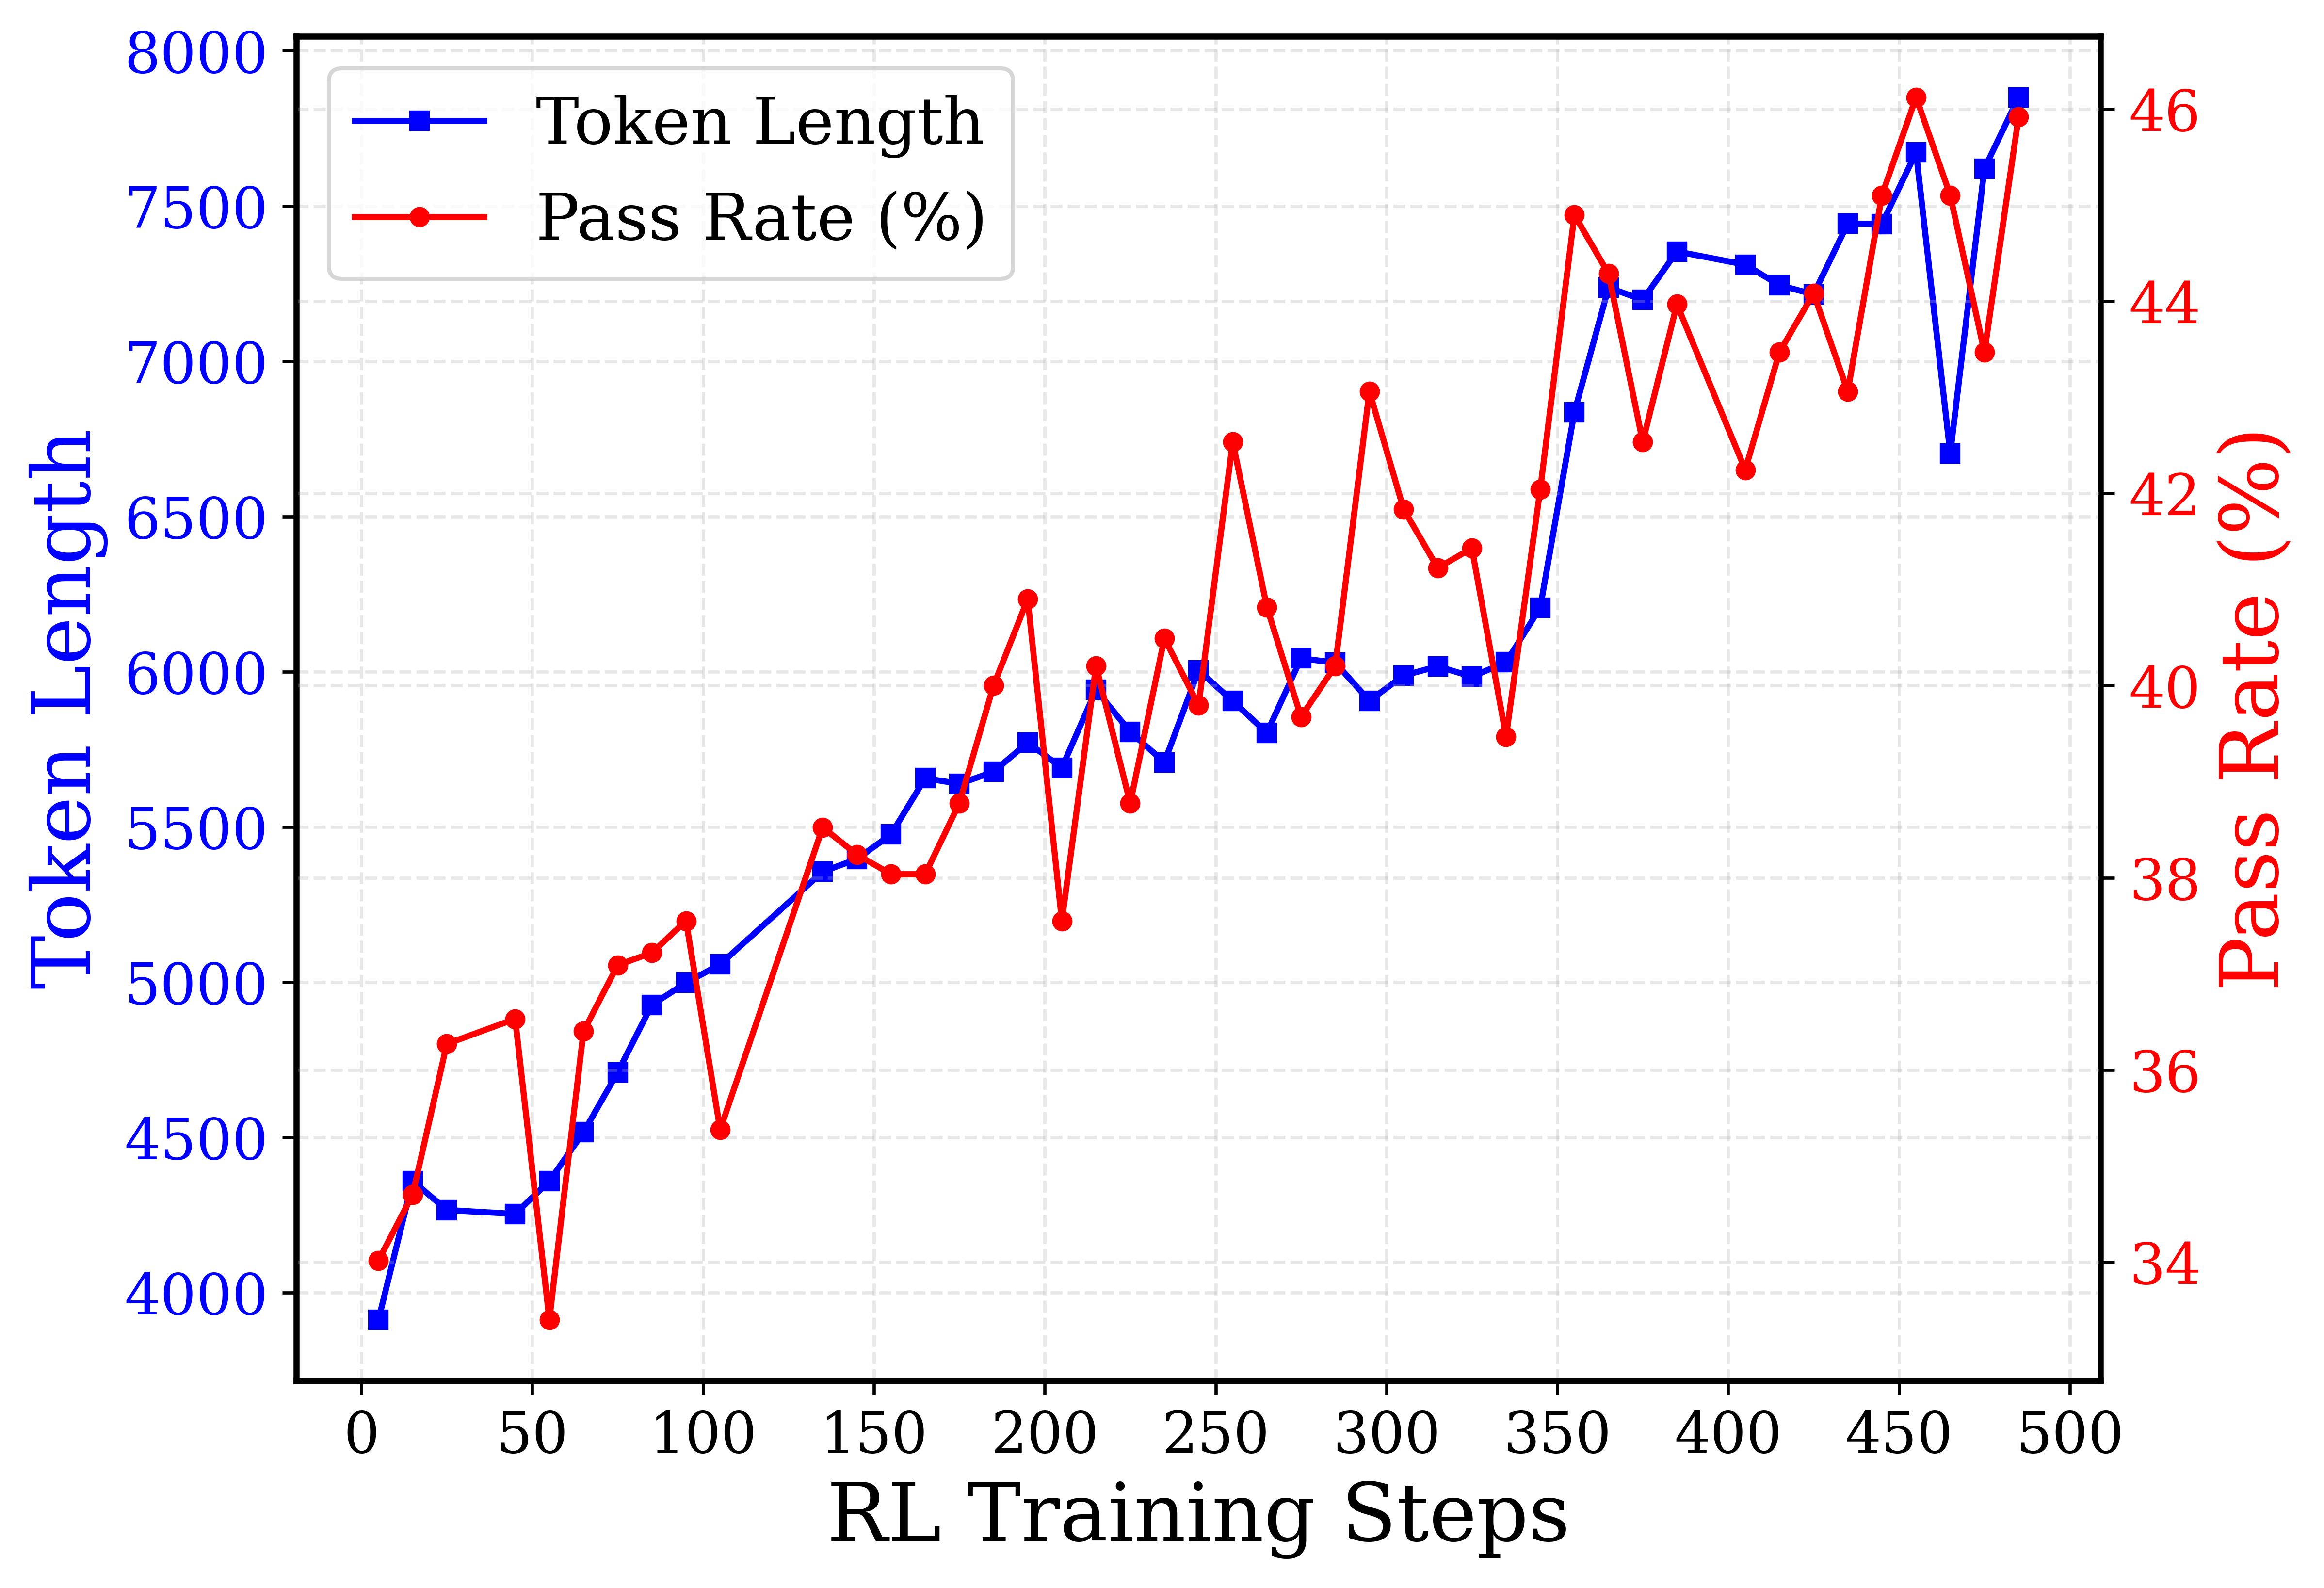
## Line Chart: RL Training Performance
### Overview
This image presents a line chart illustrating the relationship between RL Training Steps, Token Length, and Pass Rate (%). The chart displays two data series plotted against the x-axis of RL Training Steps, ranging from 0 to 500. The left y-axis represents Token Length, and the right y-axis represents Pass Rate (%).
### Components/Axes
* **X-axis:** RL Training Steps (Scale: 0 to 500, increments of 50)
* **Left Y-axis:** Token Length (Scale: 4000 to 8000, increments of 500)
* **Right Y-axis:** Pass Rate (%) (Scale: 34% to 46%, increments of 2%)
* **Legend:**
* Blue Line: Token Length
* Red Line: Pass Rate (%)
### Detailed Analysis
**Token Length (Blue Line):**
The blue line representing Token Length generally slopes upward from 0 to approximately 350 RL Training Steps, then plateaus with some fluctuations.
* At 0 RL Training Steps, Token Length is approximately 4100.
* At 50 RL Training Steps, Token Length is approximately 4600.
* At 100 RL Training Steps, Token Length is approximately 5000.
* At 150 RL Training Steps, Token Length is approximately 5500.
* At 200 RL Training Steps, Token Length is approximately 5900.
* At 250 RL Training Steps, Token Length is approximately 6100.
* At 300 RL Training Steps, Token Length is approximately 6000.
* At 350 RL Training Steps, Token Length is approximately 6200.
* At 400 RL Training Steps, Token Length is approximately 7300.
* At 450 RL Training Steps, Token Length is approximately 7400.
* At 500 RL Training Steps, Token Length is approximately 6300.
**Pass Rate (%) (Red Line):**
The red line representing Pass Rate (%) exhibits more volatility, with significant peaks and troughs throughout the 500 RL Training Steps.
* At 0 RL Training Steps, Pass Rate is approximately 35%.
* At 50 RL Training Steps, Pass Rate is approximately 41%.
* At 100 RL Training Steps, Pass Rate is approximately 38%.
* At 150 RL Training Steps, Pass Rate is approximately 41%.
* At 200 RL Training Steps, Pass Rate is approximately 44%.
* At 250 RL Training Steps, Pass Rate is approximately 47%.
* At 300 RL Training Steps, Pass Rate is approximately 42%.
* At 350 RL Training Steps, Pass Rate is approximately 40%.
* At 400 RL Training Steps, Pass Rate is approximately 43%.
* At 450 RL Training Steps, Pass Rate is approximately 46%.
* At 500 RL Training Steps, Pass Rate is approximately 44%.
### Key Observations
* The Token Length generally increases with RL Training Steps, suggesting the model learns to generate longer sequences.
* The Pass Rate (%) fluctuates considerably, indicating instability in the training process. There is no clear monotonic trend.
* There appears to be a potential inverse relationship between Token Length and Pass Rate in certain regions, where increases in Token Length are accompanied by decreases in Pass Rate, and vice versa.
* The Pass Rate reaches its maximum around 450 RL Training Steps, while the Token Length plateaus around the same point.
### Interpretation
The chart suggests that as the RL agent trains, it learns to generate longer tokens (Token Length increases). However, the Pass Rate does not consistently improve with increasing Token Length, indicating that simply generating longer sequences does not necessarily lead to better performance. The fluctuations in Pass Rate suggest that the training process is sensitive to various factors and may require further tuning or regularization. The plateau in Token Length after 350 steps could indicate the model has reached a limit in its ability to generate longer sequences with the current configuration, or that further increases in length do not contribute to improved performance. The inverse relationship observed in certain regions warrants further investigation to understand the trade-off between sequence length and accuracy. The data suggests that the model is learning, but the learning process is not stable and requires further optimization to achieve consistent improvements in Pass Rate.