\n
## Dual-Axis Line Chart: RL Training Steps vs. Token Length and Pass Rate
### Overview
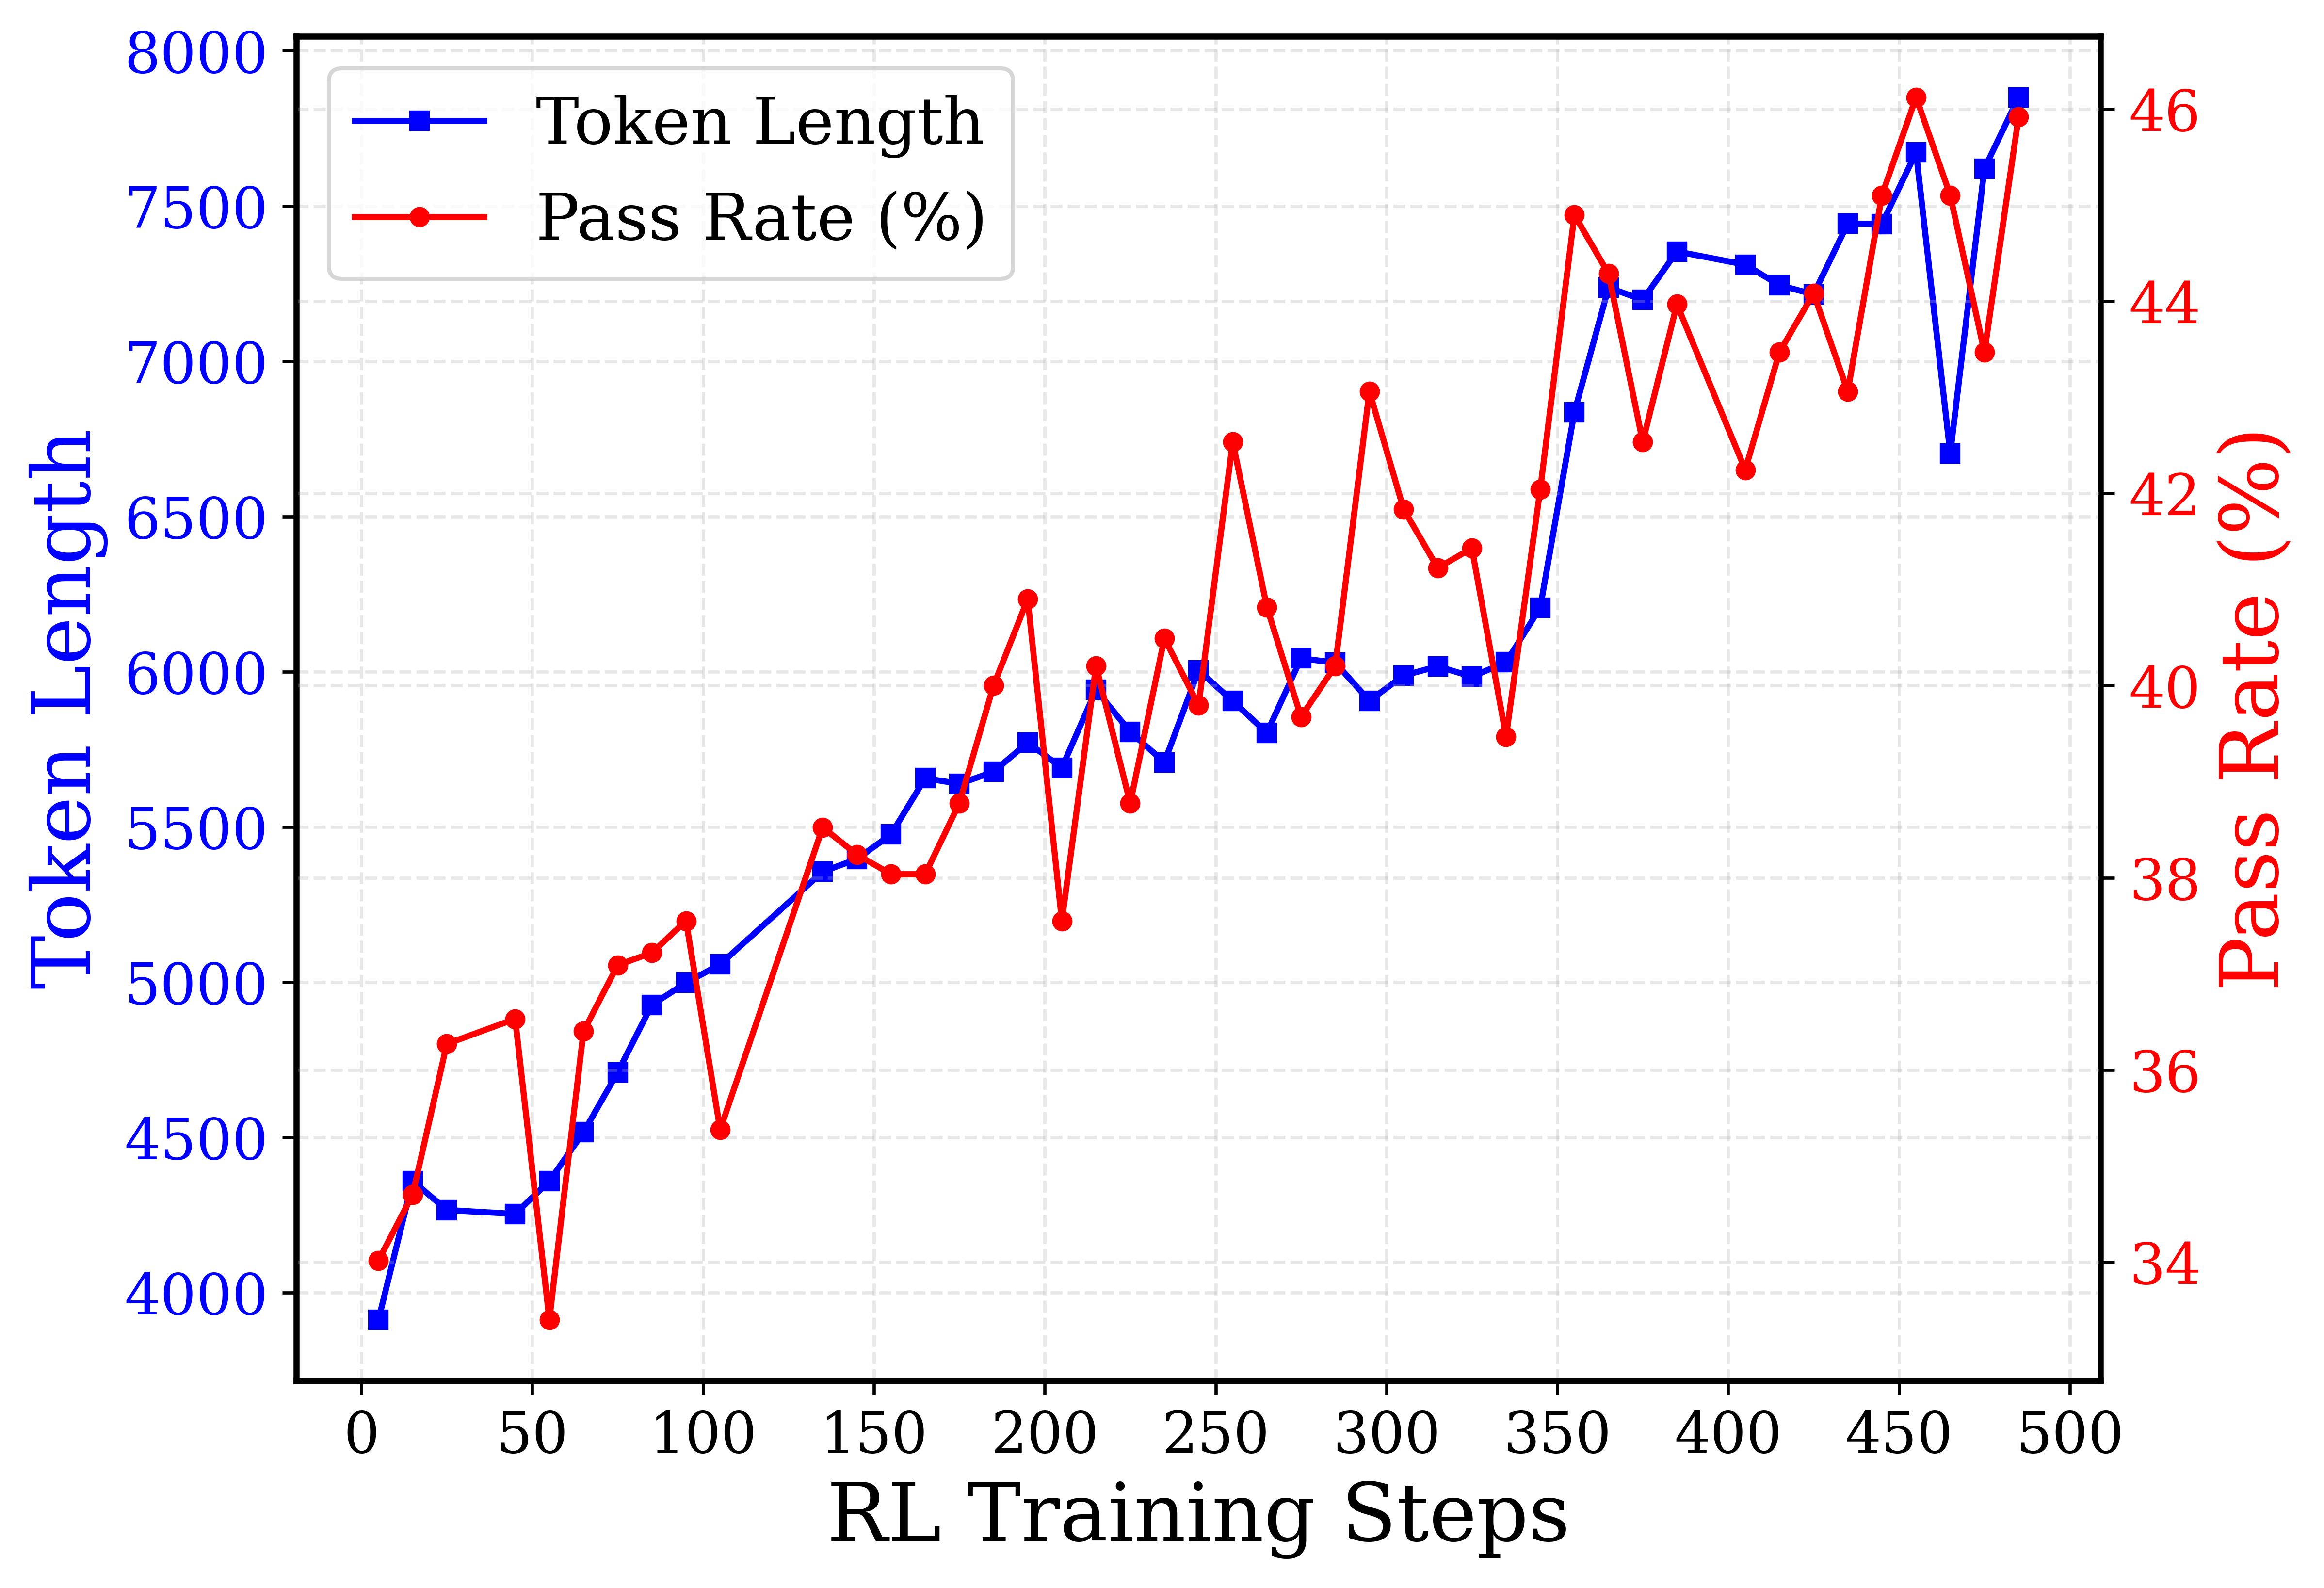
This is a dual-axis line chart plotting two metrics—Token Length and Pass Rate (%)—against the number of Reinforcement Learning (RL) training steps. The chart shows the progression of both metrics over 500 training steps, indicating a general upward trend for both, with the Pass Rate exhibiting significantly more volatility.
### Components/Axes
* **Chart Type:** Dual-axis line chart.
* **X-Axis (Bottom):**
* **Label:** "RL Training Steps"
* **Scale:** Linear, from 0 to 500.
* **Major Tick Marks:** Every 50 steps (0, 50, 100, 150, 200, 250, 300, 350, 400, 450, 500).
* **Primary Y-Axis (Left):**
* **Label:** "Token Length" (in blue text).
* **Scale:** Linear, from 4000 to 8000.
* **Major Tick Marks:** Every 500 units (4000, 4500, 5000, 5500, 6000, 6500, 7000, 7500, 8000).
* **Secondary Y-Axis (Right):**
* **Label:** "Pass Rate (%)" (in red text).
* **Scale:** Linear, from 34% to 46%.
* **Major Tick Marks:** Every 2% (34, 36, 38, 40, 42, 44, 46).
* **Legend (Top-Left Corner):**
* **Blue line with square markers:** "Token Length"
* **Red line with circle markers:** "Pass Rate (%)"
* **Data Series:**
1. **Token Length (Blue Line, Square Markers):** Plotted against the left Y-axis.
2. **Pass Rate (Red Line, Circle Markers):** Plotted against the right Y-axis.
### Detailed Analysis
**Trend Verification:**
* **Token Length (Blue):** Shows a clear, generally upward trend from ~3900 at step 0 to ~7800 at step 500. The increase is not perfectly smooth; there are minor dips and plateaus (e.g., around steps 50, 200, and 475).
* **Pass Rate (Red):** Also shows an overall upward trend from ~34% at step 0 to ~46% at step 500. This trend is highly volatile, characterized by sharp peaks and troughs throughout the training process.
**Approximate Data Points (Selected Key Points):**
*Note: Values are approximate based on visual inspection of the chart.*
| RL Training Steps | Token Length (Approx.) | Pass Rate (%) (Approx.) |
| :--- | :--- | :--- |
| 0 | 3900 | 34.0 |
| 50 | 4250 | 36.5 |
| 100 | 5000 | 35.0 |
| 150 | 5500 | 38.5 |
| 200 | 5700 | 41.0 |
| 250 | 5900 | 42.5 |
| 300 | 5900 | 43.0 |
| 350 | 6200 | 42.0 |
| 400 | 7200 | 44.0 |
| 450 | 7400 | 46.0 |
| 475 | 6700 | 43.5 |
| 500 | 7800 | 46.0 |
**Notable Volatility in Pass Rate:**
* A sharp drop occurs around step 50 (to ~34%).
* A significant peak occurs around step 250 (to ~42.5%).
* Another major peak is visible around step 450 (to ~46.0%).
* A pronounced dip follows the peak at step 450, dropping to ~43.5% at step 475 before recovering.
### Key Observations
1. **Correlated General Trend:** Both metrics improve over the course of training, suggesting that as the model trains longer (more RL steps), it tends to generate longer token sequences and achieve a higher pass rate on the evaluated task.
2. **Divergent Volatility:** The Pass Rate is far more sensitive to training steps, exhibiting large swings, while the Token Length increases more steadily. This indicates that the quality or success rate (Pass Rate) of the model's outputs is less stable during training than the length of the outputs.
3. **Late-Stage Performance:** The highest values for both metrics are achieved in the final 100 steps (400-500), with Token Length reaching near 8000 and Pass Rate hitting 46%.
4. **Potential Overfitting or Policy Shift:** The sharp drop in Pass Rate after its peak at step 450, while Token Length remains high, could indicate a phase where the model's outputs become longer but less correct or aligned, a potential sign of overfitting or a shift in the learned policy.
### Interpretation
The data demonstrates the progression of a reinforcement learning process for a language model. The x-axis ("RL Training Steps") represents the duration of training. The two y-axes track different aspects of the model's output:
* **Token Length** is a measure of output verbosity or complexity.
* **Pass Rate (%)** is a measure of output correctness or task success.
The chart suggests that with more training, the model learns to produce longer and, on average, more correct responses. However, the path to improvement is not linear, especially for correctness. The high volatility in Pass Rate implies that the training process involves periods of exploration where performance can degrade temporarily before improving. The strong correlation in the final steps suggests the training may be converging toward an optimal policy that balances length and correctness. The divergence at step 475 is a critical point for investigation, as it shows a temporary decoupling of length and success rate.