# Technical Document Extraction: Line Chart Analysis
## Chart Overview
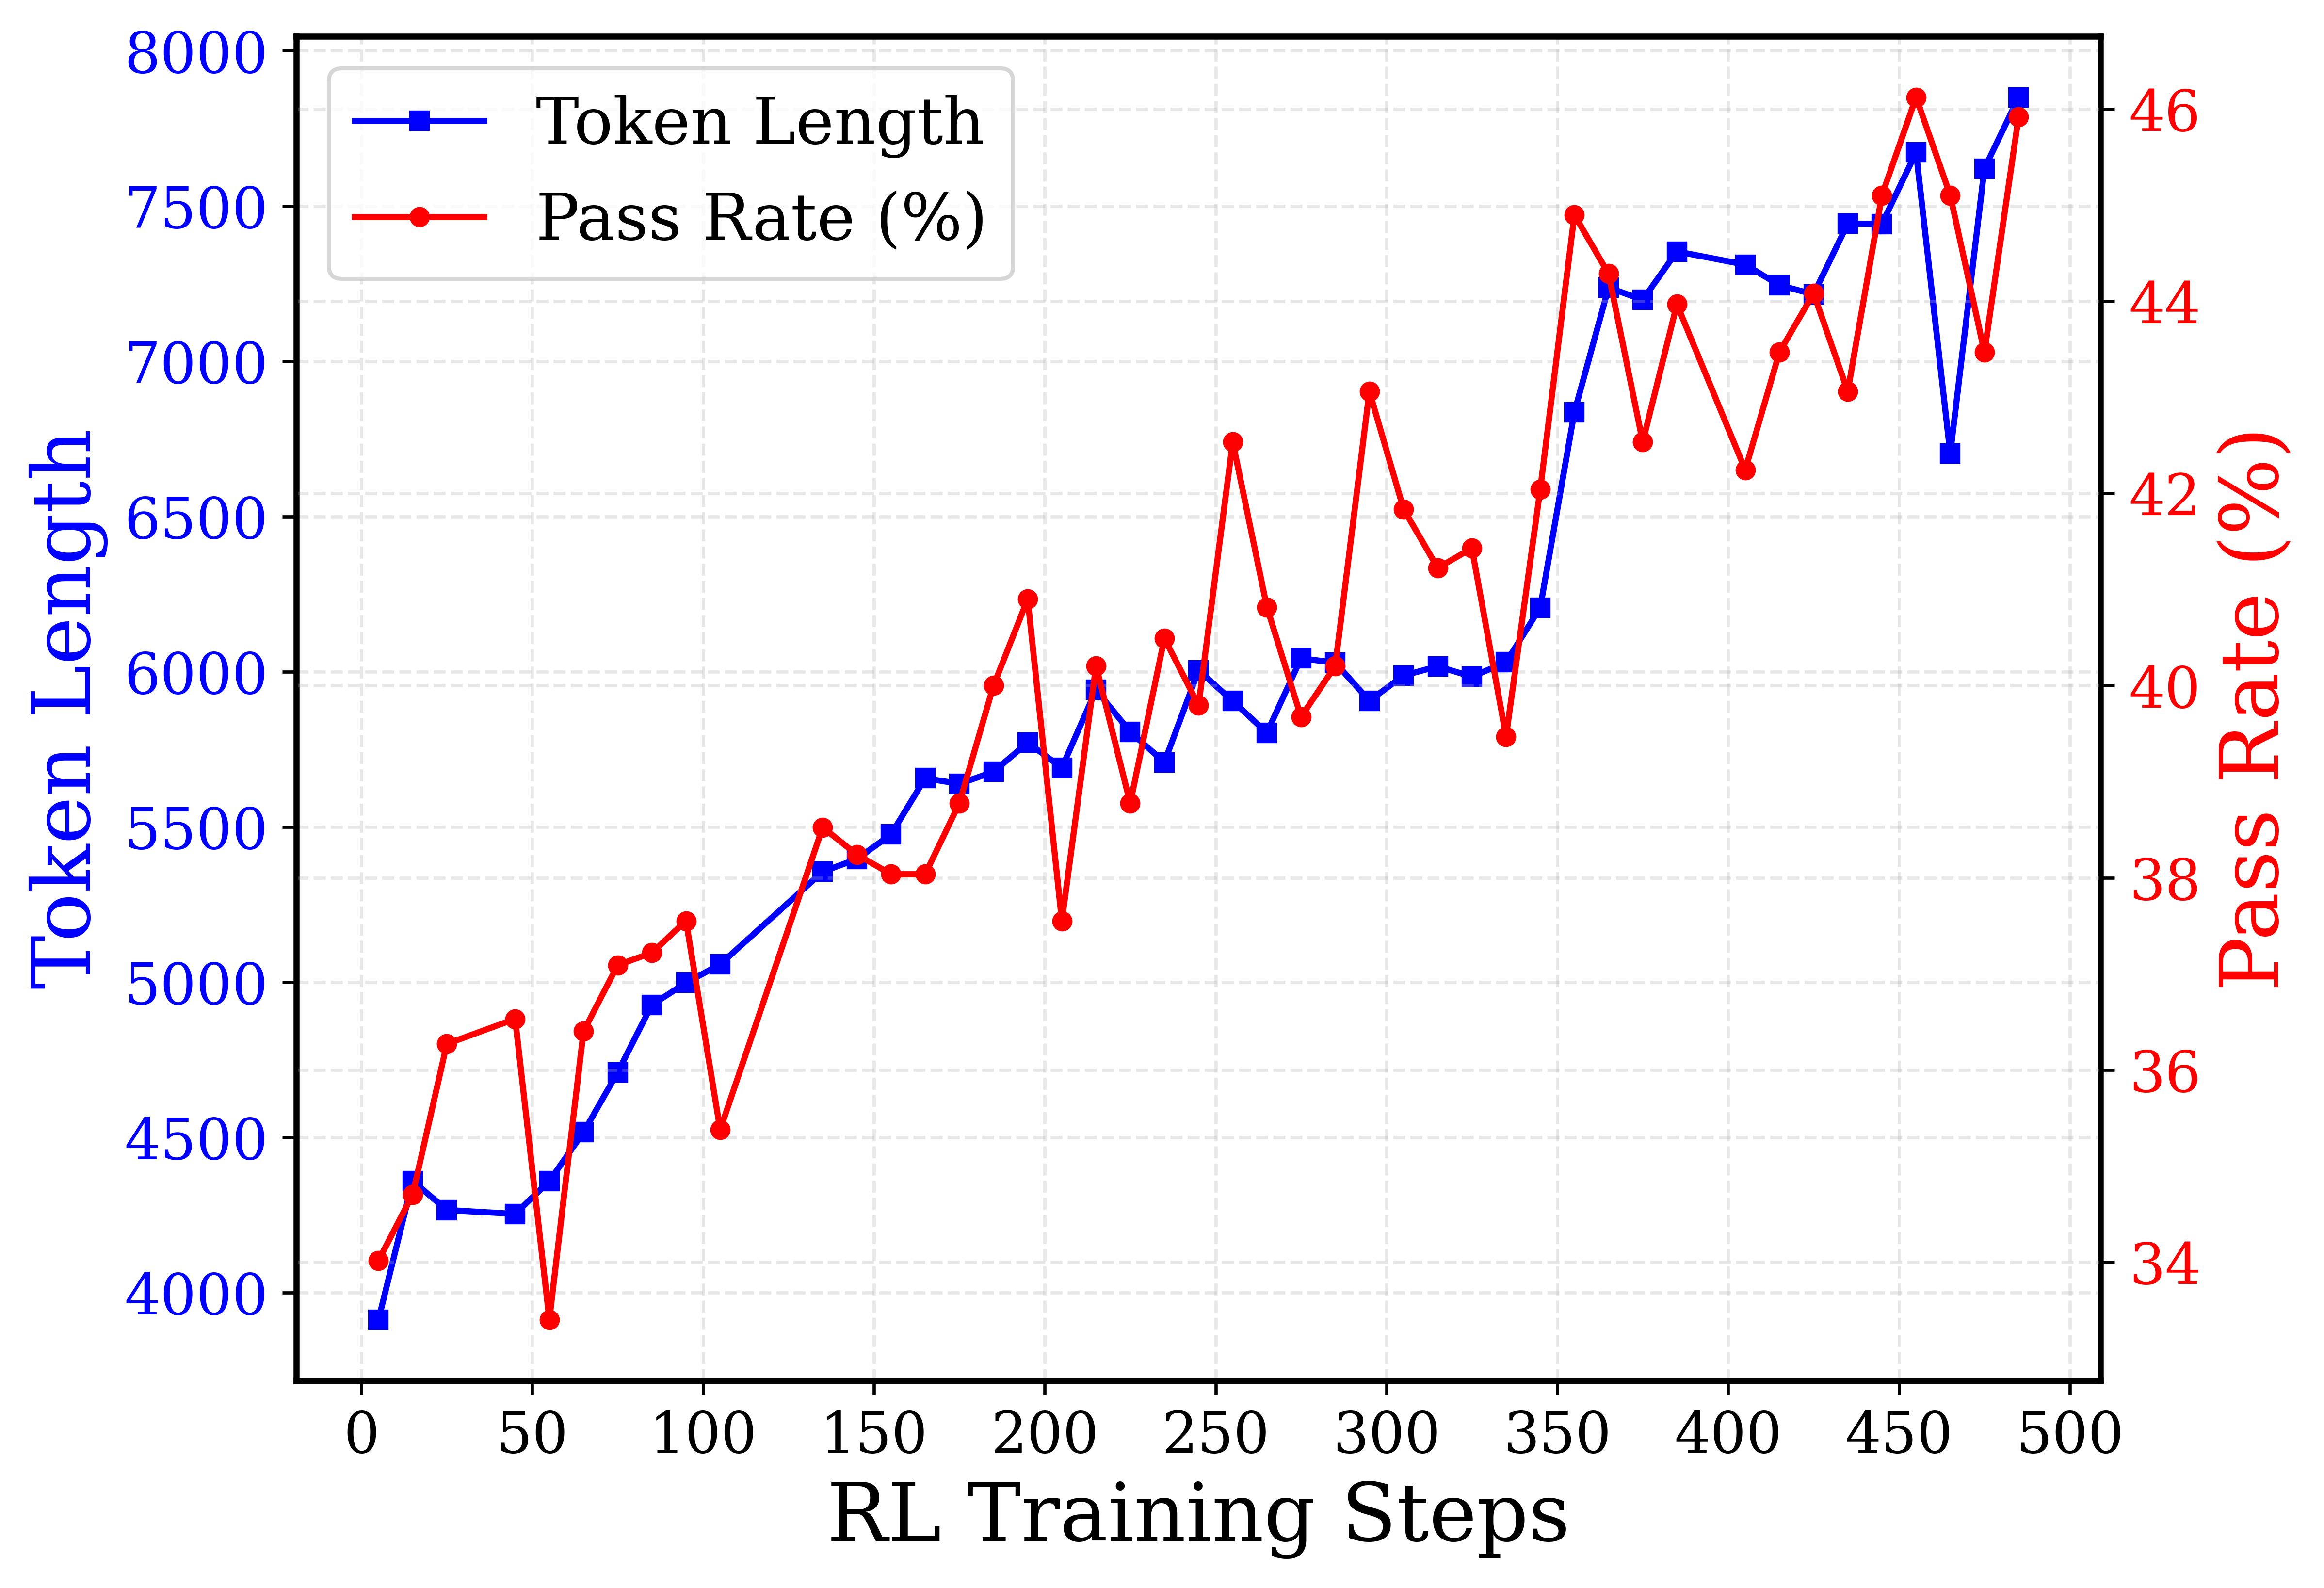
The image depicts a line chart with two data series plotted against RL Training Steps. The chart contains:
- **Primary Y-axis (Left):** Token Length (blue squares)
- **Secondary Y-axis (Right):** Pass Rate (%) (red circles)
- **X-axis:** RL Training Steps (0–500)
## Legend
- **Position:** Top-left corner
- **Color Coding:**
- Blue squares: Token Length
- Red circles: Pass Rate (%)
## Axis Labels
- **X-axis:** "RL Training Steps" (0–500 in increments of 50)
- **Primary Y-axis:** "Token Length" (3,900–8,000 in increments of 500)
- **Secondary Y-axis:** "Pass Rate (%)" (34%–46% in increments of 2%)
## Data Series Analysis
### Token Length (Blue Squares)
- **Trend:** Steady upward trajectory with minor fluctuations
- **Key Data Points:**
- [0, 3900]
- [50, 4300]
- [100, 5050]
- [150, 5400]
- [200, 5600]
- [250, 5800]
- [300, 5950]
- [350, 6200]
- [400, 7300]
- [450, 7600]
- [500, 7800]
### Pass Rate (%) (Red Circles)
- **Trend:** Volatile with significant peaks and troughs
- **Key Data Points:**
- [0, 34%]
- [50, 36%]
- [100, 38%]
- [150, 38%]
- [200, 40%]
- [250, 42%]
- [300, 44%]
- [350, 43%]
- [400, 44%]
- [450, 46%]
- [500, 46%]
## Spatial Grounding
- **Legend Coordinates:** [x: 0.05, y: 0.95] (top-left corner)
- **Data Point Verification:**
- Blue squares consistently match Token Length values
- Red circles consistently match Pass Rate values
## Trend Verification
1. **Token Length:**
- Initial plateau (3900–4300)
- Accelerated growth post-100 steps
- Steep increase after 350 steps
2. **Pass Rate:**
- Gradual improvement until 250 steps
- Sharp peak at 300 steps (44%)
- Post-350 steps: Stabilization with minor fluctuations
## Component Isolation
- **Main Chart:** Line graph with dual Y-axes
- **No additional regions** (header/footer) present
## Data Table Reconstruction
| RL Training Steps | Token Length | Pass Rate (%) |
|-------------------|--------------|---------------|
| 0 | 3900 | 34% |
| 50 | 4300 | 36% |
| 100 | 5050 | 38% |
| 150 | 5400 | 38% |
| 200 | 5600 | 40% |
| 250 | 5800 | 42% |
| 300 | 5950 | 44% |
| 350 | 6200 | 43% |
| 400 | 7300 | 44% |
| 450 | 7600 | 46% |
| 500 | 7800 | 46% |
## Critical Observations
1. Token Length increases by **3,900 units** (100% growth) over 500 steps
2. Pass Rate demonstrates **non-linear improvement**, with:
- 12% absolute increase (34% → 46%)
- 33% relative improvement
3. Divergence between metrics observed post-350 steps:
- Token Length: +1,600 units (25.8% growth)
- Pass Rate: +2% (4.5% growth)
## Language Note
All textual content is in English. No non-English elements detected.