## Line Charts: Six Variations of Converging/Diverging Lines
### Overview
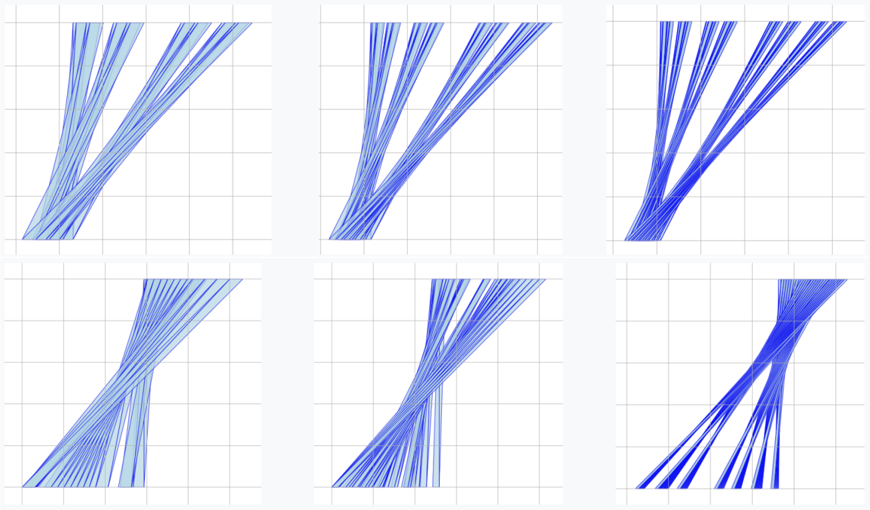
The image presents six separate line charts arranged in a 2x3 grid. Each chart displays multiple blue lines that either converge towards a point or diverge from a point. The charts lack axis labels or numerical scales, making it impossible to extract precise quantitative data. The focus is on the visual patterns of convergence and divergence.
### Components/Axes
* **Axes:** Each chart has a horizontal and vertical axis, but they are unlabeled and unscaled. The axes are represented by light gray grid lines.
* **Lines:** Each chart contains multiple blue lines. The lines are of similar thickness and color.
* **Grid:** Each chart has a grid of light gray lines.
### Detailed Analysis
**Chart 1 (Top-Left):**
* The blue lines converge towards the top-right corner of the chart.
* The lines start from different points on the left side of the chart and move upwards and to the right.
* The lines are relatively straight.
**Chart 2 (Top-Middle):**
* The blue lines converge towards a point in the upper half of the chart.
* The lines originate from different points at the bottom of the chart.
* The lines are relatively straight.
**Chart 3 (Top-Right):**
* The blue lines diverge from a point in the lower half of the chart.
* The lines spread out as they move upwards.
* The lines are relatively straight.
**Chart 4 (Bottom-Left):**
* The blue lines converge towards a point in the middle of the chart and then diverge.
* The lines cross each other at the convergence point.
* The lines are relatively straight.
**Chart 5 (Bottom-Middle):**
* The blue lines converge towards a point in the middle of the chart and then diverge.
* The lines cross each other at the convergence point.
* The lines are relatively straight.
**Chart 6 (Bottom-Right):**
* The blue lines converge towards a point in the upper half of the chart.
* The lines originate from different points at the bottom of the chart.
* The lines are relatively straight.
### Key Observations
* All charts feature multiple blue lines.
* The lines in each chart exhibit either convergence, divergence, or both.
* The charts lack axis labels and scales, preventing quantitative analysis.
### Interpretation
The image presents a visual exploration of convergence and divergence patterns using simple line charts. Without axis labels or scales, the charts serve primarily as abstract visual representations. The variations in convergence and divergence points across the six charts suggest different scenarios or relationships, but their specific meaning is undefined due to the lack of context. The image could be used to illustrate different types of relationships or trends in a more abstract way.