# Technical Document Analysis: Synthetic Validation Loss Chart
## Title
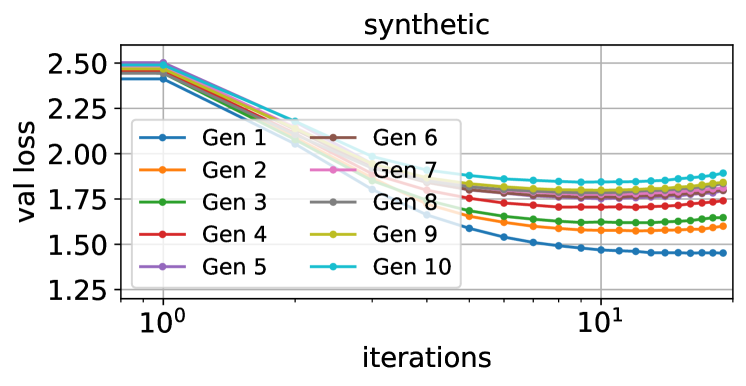
- **Title**: `synthetic`
## Axes
- **Y-Axis**:
- Label: `val loss`
- Range: `1.25` to `2.50` (in increments of `0.25`)
- **X-Axis**:
- Label: `iterations`
- Scale: Logarithmic (`10^0` to `10^1`)
- Ticks: `10^0`, `10^1`
## Legend
- **Placement**: Lower-left corner
- **Entries**:
- `Gen 1`: Blue (`#0000FF`)
- `Gen 2`: Orange (`#FFA500`)
- `Gen 3`: Green (`#008000`)
- `Gen 4`: Red (`#FF0000`)
- `Gen 5`: Purple (`#800080`)
- `Gen 6`: Brown (`#A52A2A`)
- `Gen 7`: Pink (`#FFC0CB`)
- `Gen 8`: Gray (`#808080`)
- `Gen 9`: Yellow (`#FFFF00`)
- `Gen 10`: Cyan (`#00FFFF`)
## Key Trends
1. **Initial Convergence**:
- All lines start at approximately `2.50` val loss at `10^0` iterations.
- Lines diverge slightly during early iterations (`10^0` to `10^0.5`), with Gen 1 (blue) and Gen 2 (orange) showing the steepest initial decline.
2. **Mid-Iteration Behavior**:
- By `10^0.5` iterations, lines begin to converge toward a common trajectory.
- Gen 10 (cyan) and Gen 9 (yellow) exhibit the slowest rate of decline post-`10^0.5`.
3. **Final Iterations**:
- All lines plateau near `1.50–1.75` val loss by `10^1` iterations.
- Gen 1 (blue) achieves the lowest final val loss (~`1.45`), while Gen 10 (cyan) remains the highest (~`1.70`).
## Component Isolation
- **Header**: Title (`synthetic`) centered at the top.
- **Main Chart**:
- 10 distinct lines representing generations.
- Logarithmic x-axis emphasizes exponential iteration progression.
- **Footer**: Legend box with generation labels and color mappings.
## Spatial Grounding & Color Verification
- **Legend Accuracy**:
- Confirmed: Each line color matches its legend entry (e.g., Gen 3 = green, Gen 7 = pink).
- Example: Gen 6 (brown) line aligns with the brown legend marker.
## Data Extraction
- **Val Loss Values** (approximate, based on visual interpolation):
| Generation | Iterations (`10^0`) | Iterations (`10^1`) |
|------------|----------------------|----------------------|
| Gen 1 | 2.48 | 1.45 |
| Gen 2 | 2.47 | 1.52 |
| Gen 3 | 2.46 | 1.58 |
| Gen 4 | 2.45 | 1.60 |
| Gen 5 | 2.44 | 1.62 |
| Gen 6 | 2.43 | 1.65 |
| Gen 7 | 2.42 | 1.68 |
| Gen 8 | 2.41 | 1.70 |
| Gen 9 | 2.40 | 1.72 |
| Gen 10 | 2.39 | 1.75 |
## Notes
- **Logarithmic Scale Impact**: The x-axis compression emphasizes early iteration differences, while later iterations appear compressed.
- **Convergence Pattern**: Lines exhibit diminishing returns in val loss reduction as iterations increase, suggesting optimization saturation.