## Chart: Logarithmic Functions
### Overview
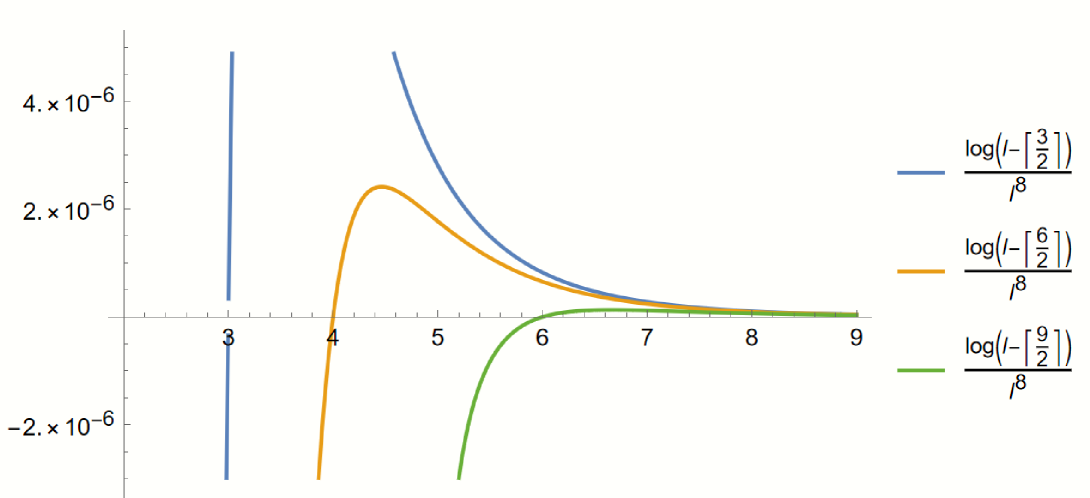
The image displays a line graph plotting three logarithmic functions against a numerical x-axis. The y-axis represents the logarithmic value, and the x-axis ranges from approximately 3 to 9. Each function is represented by a different colored line, with corresponding labels in the top-right corner.
### Components/Axes
* **X-axis:** Labeled with numerical values from 3 to 9, with tick marks at integer values.
* **Y-axis:** Labeled with logarithmic values, ranging from approximately -2.0 x 10<sup>-6</sup> to 4.0 x 10<sup>-6</sup>. The scale is logarithmic.
* **Legend:** Located in the top-right corner, listing the three functions and their corresponding colors:
* Blue: log(-[3/2]<sup>3</sup>)/ρ<sup>8</sup>
* Orange: log(-[6/2]<sup>6</sup>)/ρ<sup>8</sup>
* Green: log(-[9/2]<sup>9</sup>)/ρ<sup>8</sup>
### Detailed Analysis
**Blue Line (log(-[3/2]<sup>3</sup>)/ρ<sup>8</sup>):**
The blue line starts at a very high positive value (approximately 3.8 x 10<sup>-6</sup>) at x=3, exhibiting a sharp vertical rise. It then rapidly decreases, approaching zero as x increases. The line is monotonically decreasing after the initial spike.
* At x = 3, y ≈ 3.8 x 10<sup>-6</sup>
* At x = 4, y ≈ 2.2 x 10<sup>-6</sup>
* At x = 5, y ≈ 1.2 x 10<sup>-6</sup>
* At x = 6, y ≈ 0.7 x 10<sup>-6</sup>
* At x = 7, y ≈ 0.4 x 10<sup>-6</sup>
* At x = 8, y ≈ 0.2 x 10<sup>-6</sup>
* At x = 9, y ≈ 0.1 x 10<sup>-6</sup>
**Orange Line (log(-[6/2]<sup>6</sup>)/ρ<sup>8</sup>):**
The orange line begins at a negative value, dips to a minimum around x=3.5, then increases to a peak around x=4.2, before decreasing again. It appears to be a bell-shaped curve.
* At x = 3, y ≈ -0.5 x 10<sup>-6</sup>
* At x = 3.5, y ≈ -1.5 x 10<sup>-6</sup>
* At x = 4, y ≈ 2.2 x 10<sup>-6</sup>
* At x = 4.5, y ≈ 1.8 x 10<sup>-6</sup>
* At x = 5, y ≈ 1.1 x 10<sup>-6</sup>
* At x = 6, y ≈ 0.5 x 10<sup>-6</sup>
* At x = 7, y ≈ 0.2 x 10<sup>-6</sup>
* At x = 8, y ≈ 0.1 x 10<sup>-6</sup>
* At x = 9, y ≈ 0.05 x 10<sup>-6</sup>
**Green Line (log(-[9/2]<sup>9</sup>)/ρ<sup>8</sup>):**
The green line starts at a negative value, and steadily increases, crossing the x-axis around x=5.5. It continues to increase, but at a decreasing rate.
* At x = 3, y ≈ -3.0 x 10<sup>-6</sup>
* At x = 4, y ≈ -2.0 x 10<sup>-6</sup>
* At x = 5, y ≈ -0.8 x 10<sup>-6</sup>
* At x = 6, y ≈ 0.4 x 10<sup>-6</sup>
* At x = 7, y ≈ 1.0 x 10<sup>-6</sup>
* At x = 8, y ≈ 1.5 x 10<sup>-6</sup>
* At x = 9, y ≈ 1.8 x 10<sup>-6</sup>
### Key Observations
* The blue line exhibits a sharp initial increase followed by a rapid decay.
* The orange line displays a peak, suggesting a maximum value within the plotted range.
* The green line shows a continuous increase, indicating a logarithmic growth pattern.
* All three functions share a common denominator of ρ<sup>8</sup> in their logarithmic expressions.
### Interpretation
The chart demonstrates the behavior of three different logarithmic functions. The functions are all dependent on a variable ρ, which is not defined in the image. The differing exponents and arguments within the logarithms result in distinct curves. The blue line's rapid decay could represent a quickly diminishing effect, while the orange line's peak suggests an optimal value or a point of maximum impact. The green line's continuous growth indicates a sustained increase. The shared denominator of ρ<sup>8</sup> suggests that all three functions are scaled by the same factor, potentially representing a constant physical property or parameter. The negative signs within the logarithms indicate that the arguments are negative, which is permissible for complex logarithms. The chart could be used to model a physical process where these logarithmic functions represent different components or stages.