## Line Graph: Comparison of Logarithmic Functions Divided by 8th Root
### Overview
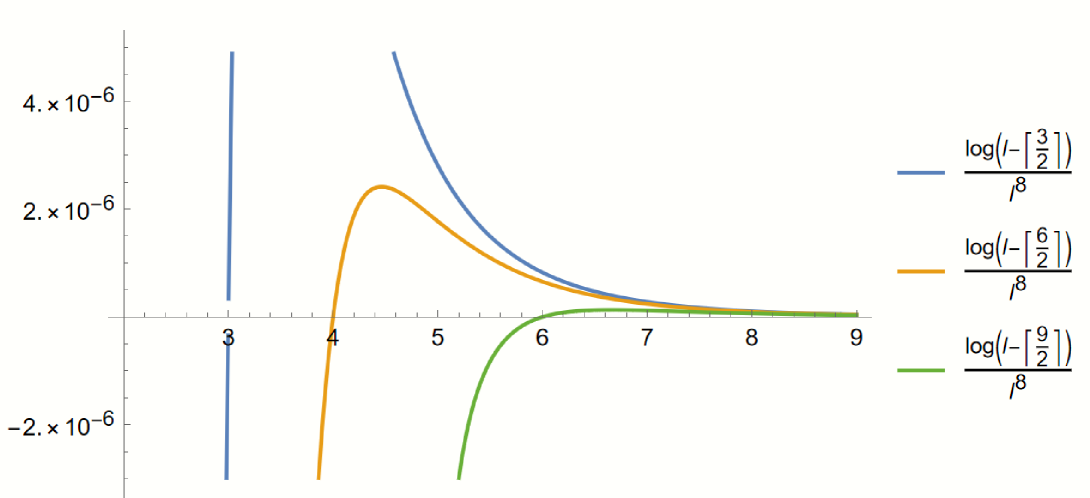
The image is a line graph comparing three logarithmic functions divided by the eighth root of a variable. The x-axis ranges from 3 to 9, and the y-axis spans from -2×10⁻⁶ to 4×10⁻⁶. Three distinct lines (blue, orange, green) represent different logarithmic expressions, with a legend on the right correlating colors to their respective functions.
### Components/Axes
- **X-axis**: Labeled with integer values from 3 to 9 (no explicit title).
- **Y-axis**: Labeled with scientific notation values (-2×10⁻⁶ to 4×10⁻⁶), no explicit title.
- **Legend**: Positioned on the right, with three entries:
- **Blue**: `log(-3/2)/8`
- **Orange**: `log(-6/2)/8`
- **Green**: `log(-9/2)/8`
### Detailed Analysis
1. **Blue Line (`log(-3/2)/8`)**:
- **Behavior**: Vertical asymptote at x=3 (infinite value), then sharply decreases.
- **Trend**: Dominates the left side of the graph, dropping rapidly toward the x-axis as x increases.
- **Key Points**:
- At x=3: Undefined (asymptote).
- At x=4: ~4×10⁻⁶.
- At x=5: ~2×10⁻⁶.
- At x=6: ~1×10⁻⁶.
2. **Orange Line (`log(-6/2)/8`)**:
- **Behavior**: Peaks at x=4.5 (~2.5×10⁻⁶), then declines smoothly.
- **Trend**: Crosses the blue line near x=5, converging with it as x increases.
- **Key Points**:
- At x=4: ~2×10⁻⁶.
- At x=5: ~1.5×10⁻⁶.
- At x=6: ~1×10⁻⁶.
3. **Green Line (`log(-9/2)/8`)**:
- **Behavior**: Starts negative (~-2×10⁻⁶ at x=3), crosses zero near x=6, then becomes positive.
- **Trend**: Gradually rises after x=6, intersecting the orange line near x=7.
- **Key Points**:
- At x=3: ~-2×10⁻⁶.
- At x=6: ~0.
- At x=7: ~1×10⁻⁶.
### Key Observations
- **Asymptotic Behavior**: The blue line exhibits a vertical asymptote at x=3, suggesting a division-by-zero scenario in its denominator.
- **Convergence**: All lines converge toward the x-axis as x increases, indicating diminishing magnitudes.
- **Zero Crossing**: The green line crosses the x-axis near x=6, transitioning from negative to positive values.
- **Peak and Intersection**: The orange line peaks at x=4.5 and intersects the blue line near x=5.
### Interpretation
The graph illustrates how logarithmic functions scaled by the eighth root of a variable behave across a domain. The vertical asymptote at x=3 for the blue line implies a critical point where the denominator approaches zero, causing the function to diverge. The orange and green lines demonstrate how varying the numerator (e.g., -3/2 vs. -9/2) affects the function's growth rate and zero-crossing behavior. The convergence of all lines toward zero as x increases suggests that the eighth root term dominates the logarithmic growth at larger x-values.
**Notable Anomaly**: The logarithmic arguments (-3/2, -6/2, -9/2) are negative, which would make the functions undefined in real-number systems. This could indicate a typo (e.g., absolute values) or a complex-number context not reflected in the graph. The y-axis values (extremely small magnitudes) further complicate interpretation, as typical logarithmic functions would not produce such results without additional scaling or constraints.