## Chart Type: Multiple Line Graphs Comparing Model Performance
### Overview
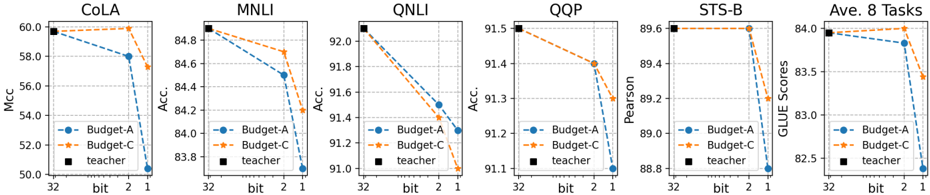
The image presents six line graphs arranged horizontally, each evaluating the performance of different models (Budget-A, Budget-C, and Teacher) on various tasks (CoLA, MNLI, QNLI, QQP, STS-B, and Average of 8 Tasks). The x-axis represents the bit size (32, 2, 1), and the y-axis represents the performance metric specific to each task (Mcc, Accuracy, Pearson, GLUE Scores). The graphs compare the performance of two budget models (A and C) against a teacher model.
### Components/Axes
* **X-Axis:** "bit" with values 32, 2, and 1. The x-axis is consistent across all six graphs.
* **Y-Axis:** Varies depending on the task:
* **CoLA:** "Mcc" (Matthews correlation coefficient), scale from 50.0 to 60.0.
* **MNLI:** "Acc." (Accuracy), scale from 83.8 to 84.8.
* **QNLI:** "Acc." (Accuracy), scale from 91.0 to 92.0.
* **QQP:** "Acc." (Accuracy), scale from 91.1 to 91.5.
* **STS-B:** "Pearson", scale from 88.8 to 89.6.
* **Ave. 8 Tasks:** "GLUE Scores", scale from 82.5 to 84.0.
* **Legend:** Located below each graph, indicating:
* **Blue Line with Circle Markers:** "Budget-A"
* **Orange Dashed Line with Star Markers:** "Budget-C"
* **Black Square Marker:** "teacher"
### Detailed Analysis
**1. CoLA**
* **Budget-A (Blue):** Starts at approximately 60.0 at bit=32, decreases to approximately 58.0 at bit=2, and further decreases to approximately 50.5 at bit=1.
* **Budget-C (Orange):** Remains relatively constant at approximately 60.0 across all bit values.
* **Teacher (Black):** Constant at approximately 60.0.
**2. MNLI**
* **Budget-A (Blue):** Starts at approximately 84.8 at bit=32, decreases to approximately 84.5 at bit=2, and further decreases to approximately 83.7 at bit=1.
* **Budget-C (Orange):** Starts at approximately 84.8 at bit=32, decreases to approximately 84.7 at bit=2, and further decreases to approximately 84.2 at bit=1.
* **Teacher (Black):** Constant at approximately 84.8.
**3. QNLI**
* **Budget-A (Blue):** Starts at approximately 92.1 at bit=32, decreases to approximately 91.6 at bit=2, and further decreases to approximately 91.2 at bit=1.
* **Budget-C (Orange):** Starts at approximately 92.1 at bit=32, decreases to approximately 91.8 at bit=2, and further decreases to approximately 91.1 at bit=1.
* **Teacher (Black):** Constant at approximately 92.1.
**4. QQP**
* **Budget-A (Blue):** Starts at approximately 91.5 at bit=32, decreases to approximately 91.3 at bit=2, and further decreases to approximately 91.2 at bit=1.
* **Budget-C (Orange):** Starts at approximately 91.5 at bit=32, decreases to approximately 91.4 at bit=2, and further decreases to approximately 91.3 at bit=1.
* **Teacher (Black):** Constant at approximately 91.5.
**5. STS-B**
* **Budget-A (Blue):** Remains relatively constant at approximately 89.6 at bit=32, decreases to approximately 89.3 at bit=2, and further decreases to approximately 89.1 at bit=1.
* **Budget-C (Orange):** Remains relatively constant at approximately 89.6 across all bit values.
* **Teacher (Black):** Constant at approximately 89.6.
**6. Ave. 8 Tasks**
* **Budget-A (Blue):** Starts at approximately 83.9 at bit=32, decreases to approximately 83.8 at bit=2, and further decreases to approximately 82.6 at bit=1.
* **Budget-C (Orange):** Starts at approximately 84.0 at bit=32, decreases to approximately 83.9 at bit=2, and further decreases to approximately 83.4 at bit=1.
* **Teacher (Black):** Constant at approximately 84.0.
### Key Observations
* The "teacher" model consistently performs at the highest level across all tasks and bit sizes.
* Both "Budget-A" and "Budget-C" models generally show a decrease in performance as the bit size decreases from 32 to 1.
* The performance drop is more pronounced for "Budget-A" in some tasks (e.g., CoLA, Ave. 8 Tasks).
* For the CoLA task, Budget-C maintains a constant performance across all bit sizes, matching the teacher model.
### Interpretation
The graphs illustrate the impact of bit size reduction on the performance of different models across various natural language processing tasks. The "teacher" model serves as a benchmark, demonstrating the potential performance ceiling. The "Budget-A" and "Budget-C" models, presumably smaller or more efficient versions, experience performance degradation as the bit size is reduced, indicating a trade-off between model size/efficiency and accuracy. The extent of this degradation varies depending on the task and the specific budget model. The CoLA task shows a unique case where Budget-C maintains performance, suggesting it may be more robust to bit size reduction for this particular task. Overall, the data suggests that reducing bit size can negatively impact model performance, and the choice of model architecture (Budget-A vs. Budget-C) can influence the extent of this impact.