\n
## Line Charts: Performance Comparison of Budget-A, Budget-C, and Teacher Models Across Various Tasks
### Overview
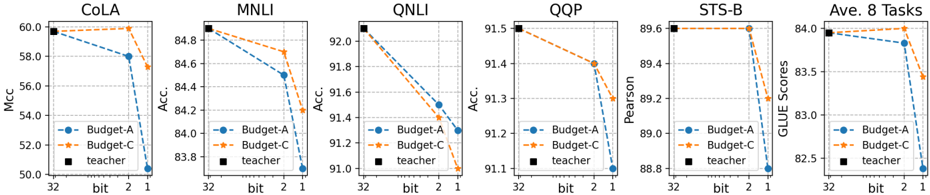
The image presents six line charts, each representing the performance of three models – Budget-A, Budget-C, and a "teacher" model – on different natural language processing (NLP) tasks. The charts display how performance metrics change with varying bit precisions (1, 2, and 32 bit). The tasks are COLA, MNLI, QNLI, QQP, STS-B, and an average across all tasks ("Ave. 8 Tasks").
### Components/Axes
Each chart shares the following components:
* **X-axis:** Bit precision (labeled as "bit" with markers at 32, 2, and 1).
* **Y-axis:** Performance metric (varying across charts):
* COLA: Matthews Correlation Coefficient (Mcc)
* MNLI, QNLI, QQP: Accuracy (Acc.)
* STS-B: Pearson correlation
* Ave. 8 Tasks: GLUE Scores
* **Legend:** Located in the bottom-left corner of each chart, identifying the three models:
* Budget-A (Blue, dashed line)
* Budget-C (Orange, dashed-dotted line)
* Teacher (Black, solid line with square markers)
* **Title:** Each chart has a title indicating the specific task being evaluated (e.g., "COLA", "MNLI").
### Detailed Analysis or Content Details
**1. COLA:**
* The "teacher" model starts at approximately 59.5 and remains relatively flat across bit precisions.
* Budget-A starts at approximately 57.5 at 32 bit, decreases to around 56.5 at 2 bit, and further to approximately 55.5 at 1 bit.
* Budget-C starts at approximately 58.5 at 32 bit, decreases to around 57.5 at 2 bit, and further to approximately 56.5 at 1 bit.
**2. MNLI:**
* The "teacher" model starts at approximately 88.5 and remains relatively flat across bit precisions.
* Budget-A starts at approximately 84.5 at 32 bit, decreases to around 83.5 at 2 bit, and further to approximately 82.5 at 1 bit.
* Budget-C starts at approximately 85.5 at 32 bit, decreases to around 84.5 at 2 bit, and further to approximately 83.5 at 1 bit.
**3. QNLI:**
* The "teacher" model starts at approximately 92.5 and remains relatively flat across bit precisions.
* Budget-A starts at approximately 91.5 at 32 bit, decreases to around 91.0 at 2 bit, and further to approximately 90.5 at 1 bit.
* Budget-C starts at approximately 92.0 at 32 bit, decreases to around 91.5 at 2 bit, and further to approximately 91.0 at 1 bit.
**4. QQP:**
* The "teacher" model starts at approximately 95.0 and remains relatively flat across bit precisions.
* Budget-A starts at approximately 94.0 at 32 bit, decreases to around 93.5 at 2 bit, and further to approximately 93.0 at 1 bit.
* Budget-C starts at approximately 94.5 at 32 bit, decreases to around 94.0 at 2 bit, and further to approximately 93.5 at 1 bit.
**5. STS-B:**
* The "teacher" model starts at approximately 89.5 and remains relatively flat across bit precisions.
* Budget-A starts at approximately 89.0 at 32 bit, decreases to around 88.5 at 2 bit, and further to approximately 88.0 at 1 bit.
* Budget-C starts at approximately 90.0 at 32 bit, decreases to around 89.5 at 2 bit, and further to approximately 89.0 at 1 bit.
**6. Ave. 8 Tasks:**
* The "teacher" model starts at approximately 84.0 and remains relatively flat across bit precisions.
* Budget-A starts at approximately 83.0 at 32 bit, decreases to around 82.0 at 2 bit, and further to approximately 81.0 at 1 bit.
* Budget-C starts at approximately 83.5 at 32 bit, decreases to around 82.5 at 2 bit, and further to approximately 81.5 at 1 bit.
### Key Observations
* Across all tasks, the "teacher" model consistently outperforms both Budget-A and Budget-C, and its performance is largely unaffected by changes in bit precision.
* Both Budget-A and Budget-C exhibit a decreasing trend in performance as bit precision decreases.
* Budget-C generally performs slightly better than Budget-A across all tasks and bit precisions.
* The performance drop from 32-bit to 2-bit and 1-bit is more pronounced for Budget-A and Budget-C than for the teacher model.
### Interpretation
The data suggests that reducing bit precision has a more detrimental effect on the performance of smaller models (Budget-A and Budget-C) compared to a larger, more robust model ("teacher"). This indicates that the smaller models are more sensitive to the loss of information caused by lower precision. The consistent outperformance of the teacher model highlights the benefits of model size and capacity. The relatively stable performance of the teacher model across different bit precisions suggests that it has learned more robust representations that are less susceptible to quantization errors. The slight advantage of Budget-C over Budget-A could be due to architectural differences or training procedures. Overall, the charts demonstrate a trade-off between model size/complexity and sensitivity to quantization, with larger models being more resilient to reduced precision.