## Line Graphs: Model Performance Across Tasks
### Overview
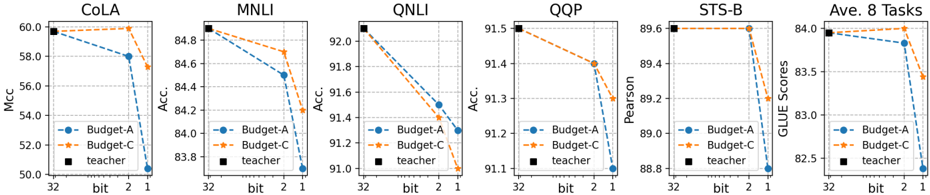
The image contains six line graphs comparing the performance of three models (Budget-A, Budget-C, and Teacher) across six natural language processing tasks: CoLA, MNLI, QNLI, QQP, STS-B, and Ave. 8 Tasks. Each graph plots accuracy (%) on the y-axis against model compression (bits: 32, 2, 1) on the x-axis. The graphs use dashed lines for Budget-A (blue), Budget-C (orange), and solid lines for the Teacher model (black).
---
### Components/Axes
- **X-axis**: Labeled "bit" with discrete values: 32 (full precision), 2 (low precision), and 1 (extreme compression).
- **Y-axis**: Labeled "Acc." (Accuracy, %) with ranges varying by task:
- CoLA: 50–60%
- MNLI: 83–85%
- QNLI: 91–92%
- QQP: 91–92%
- STS-B: 88–89.6%
- Ave. 8 Tasks: 82.5–84%
- **Legend**: Positioned in the bottom-left corner of each graph, with:
- Blue dashed line: Budget-A
- Orange dashed line: Budget-C
- Black solid line: Teacher
---
### Detailed Analysis
#### CoLA
- **Budget-A**: Starts at 58% (32 bits), drops to 56% (2 bits), then 54% (1 bit).
- **Budget-C**: Starts at 59% (32 bits), drops to 57% (2 bits), then 55% (1 bit).
- **Teacher**: Flat at 58% across all bits.
#### MNLI
- **Budget-A**: Starts at 84.8% (32 bits), drops to 84.2% (2 bits), then 83.8% (1 bit).
- **Budget-C**: Starts at 84.6% (32 bits), drops to 84.0% (2 bits), then 83.6% (1 bit).
- **Teacher**: Flat at 84.8% across all bits.
#### QNLI
- **Budget-A**: Starts at 91.8% (32 bits), drops to 91.4% (2 bits), then 91.0% (1 bit).
- **Budget-C**: Starts at 91.6% (32 bits), drops to 91.2% (2 bits), then 90.8% (1 bit).
- **Teacher**: Flat at 91.8% across all bits.
#### QQP
- **Budget-A**: Starts at 91.5% (32 bits), drops to 91.3% (2 bits), then 91.1% (1 bit).
- **Budget-C**: Starts at 91.4% (32 bits), drops to 91.2% (2 bits), then 91.0% (1 bit).
- **Teacher**: Flat at 91.5% across all bits.
#### STS-B
- **Budget-A**: Starts at 89.6% (32 bits), drops to 89.4% (2 bits), then 89.2% (1 bit).
- **Budget-C**: Starts at 89.6% (32 bits), drops to 89.4% (2 bits), then 89.2% (1 bit).
- **Teacher**: Flat at 89.6% across all bits.
#### Ave. 8 Tasks
- **Budget-A**: Starts at 84% (32 bits), drops to 83.7% (2 bits), then 82.7% (1 bit).
- **Budget-C**: Starts at 84% (32 bits), drops to 83.7% (2 bits), then 83.3% (1 bit).
- **Teacher**: Flat at 84% across all bits.
---
### Key Observations
1. **Consistent Decline in Budget Models**: Both Budget-A and Budget-C show a downward trend in accuracy as model compression increases (32 → 2 → 1 bits).
2. **Teacher Model Robustness**: The Teacher model maintains stable accuracy across all tasks and compression levels, indicating superior robustness to quantization.
3. **Task-Specific Performance**:
- QNLI and QQP show the highest accuracy (91–92%) but are sensitive to compression.
- STS-B and CoLA exhibit smaller accuracy drops compared to MNLI and QNLI.
4. **Budget-C vs. Budget-A**: Budget-C consistently outperforms Budget-A in all tasks, though both follow similar compression trends.
---
### Interpretation
The data demonstrates that model compression (reducing bits) degrades performance for Budget-A and Budget-C, with steeper declines observed in tasks requiring higher precision (e.g., QNLI, QQP). The Teacher model’s stability suggests it is less affected by quantization, likely due to its larger capacity or more robust training. This highlights a trade-off between model efficiency (via compression) and accuracy, with the Teacher model serving as a benchmark for minimal performance loss. The consistent outperformance of Budget-C over Budget-A implies architectural or training differences that enhance its resilience to compression.