# Technical Document Extraction: DMMath Log-Log Plot
## 1. Component Isolation
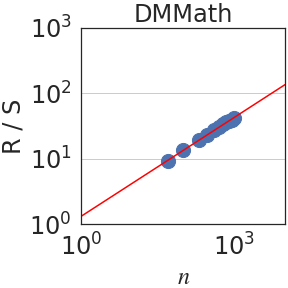
* **Header:** Contains the title "DMMath".
* **Main Chart Area:** A log-log scatter plot with a linear regression line. It features a white background with light gray horizontal grid lines.
* **Footer/Axes:** Contains the x-axis label "$n$" and the y-axis label "$R/S$".
## 2. Metadata and Labels
* **Title:** DMMath
* **Y-Axis Label:** $R/S$
* **X-Axis Label:** $n$
* **Y-Axis Scale:** Logarithmic (base 10), ranging from $10^0$ to $10^3$. Major tick marks are at $10^0$, $10^1$, $10^2$, and $10^3$.
* **X-Axis Scale:** Logarithmic (base 10), ranging from $10^0$ to approximately $2 \times 10^3$. Major tick marks are visible at $10^0$ and $10^3$.
## 3. Data Series Analysis
### Series 1: Regression Line
* **Color:** Red
* **Visual Trend:** The line slopes upward with a constant positive gradient on the log-log scale, indicating a power-law relationship between $n$ and $R/S$.
* **Placement:** The line originates at approximately $[10^0, 1.2 \times 10^0]$ and extends through the data points toward the top right corner of the plot.
### Series 2: Data Points
* **Color:** Blue (Large circular markers)
* **Visual Trend:** The points are tightly clustered along the red regression line, showing a very strong positive correlation. The data points are concentrated in the upper-middle section of the chart.
* **Estimated Data Range:**
* **Lower Bound:** Approximately $n \approx 3 \times 10^1$, $R/S \approx 9 \times 10^0$.
* **Upper Bound:** Approximately $n \approx 10^3$, $R/S \approx 4 \times 10^1$.
## 4. Key Trends and Data Points
The chart illustrates a scaling relationship. Because both axes are logarithmic, the linear appearance of the data suggests a relationship of the form:
$$\log(R/S) = m \cdot \log(n) + c$$
which translates to the power law:
$$R/S = k \cdot n^m$$
* **Slope ($m$):** Visually, the line rises approximately 1.5 orders of magnitude on the y-axis for every 3 orders of magnitude on the x-axis. This suggests a slope (scaling exponent) of roughly $0.5$.
* **Intercept:** At $n = 10^0$ (1), the value of $R/S$ is approximately $1.2$.
## 5. Summary Table of Visual Markers
| Axis | Label | Minimum Value | Maximum Value | Scale Type |
| :--- | :--- | :--- | :--- | :--- |
| **X-Axis** | $n$ | $10^0$ | $\approx 2 \times 10^3$ | Logarithmic |
| **Y-Axis** | $R/S$ | $10^0$ | $10^3$ | Logarithmic |
| Element | Color | Description |
| :--- | :--- | :--- |
| **Data Points** | Blue | Observed values for DMMath, following a linear trend on log-log scale. |
| **Trend Line** | Red | Linear regression fit representing the power-law model. |