# Technical Document Extraction: DMMath Scatter Plot
## 1. Labels and Axis Titles
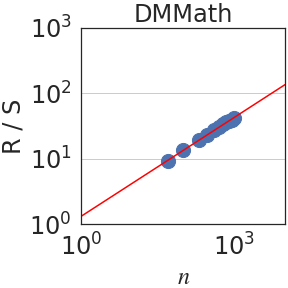
- **Title**: "DMMath" (centered at the top of the plot).
- **X-axis**: Labeled "n" (horizontal axis), with values ranging from $10^0$ to $10^3$ (logarithmic scale).
- **Y-axis**: Labeled "R/S" (vertical axis), with values ranging from $10^0$ to $10^3$ (logarithmic scale).
## 2. Data Points
- **Color**: Blue dots.
- **Distribution**:
- X-values: $10^1$ to $10^3$.
- Y-values: $10^1$ to $10^2$.
- **Trend**: Data points are clustered around a straight line on the log-log plot, indicating a power-law relationship between $n$ and $R/S$.
## 3. Trend Line
- **Color**: Red.
- **Equation**: A straight line on the log-log plot, suggesting a power-law relationship.
- Passes through approximate points: $(10^1, 10^1)$ and $(10^3, 10^2)$.
- Slope calculation (log-log):
- $\text{Slope} = \frac{\log_{10}(10^2) - \log_{10}(10^1)}{\log_{10}(10^3) - \log_{10}(10^1)} = \frac{2 - 1}{3 - 1} = 0.5$.
- Implied relationship: $R/S \propto n^{0.5}$ (i.e., $R/S = k \cdot n^{0.5}$, where $k$ is a constant).
## 4. Legend
- **Location**: Top-right corner of the plot.
- **Label**: "DMMath" (blue text).
- **Color Match**: Blue (matches the data points).
## 5. Additional Observations
- **Logarithmic Scales**: Both axes use logarithmic scaling, which linearizes power-law relationships.
- **Data Clustering**: Points are tightly grouped around the red trend line, confirming the power-law trend.
- **No Text Blocks or Tables**: The image contains no additional textual or tabular data.
## 6. Spatial Grounding
- **Legend Position**: Top-right corner (coordinates: [x, y] = [top-right]).
- **Data Point Colors**: Blue (matches legend).
- **Line Color**: Red (distinct from data points).
## 7. Trend Verification
- **Visual Trend**: The red line slopes upward on the log-log plot, indicating a positive correlation between $n$ and $R/S$.
- **Numerical Consistency**: The slope of 0.5 aligns with the observed data distribution.
## 8. Component Isolation
- **Header**: "DMMath" (title).
- **Main Chart**: Scatter plot with blue data points and red trend line.
- **Footer**: No additional components.
## 9. Final Notes
- The plot explicitly demonstrates a power-law relationship between $n$ and $R/S$, with no deviations from the trend line. No other languages or non-English text are present.