\n
## Diagram: Client Data Matching
### Overview
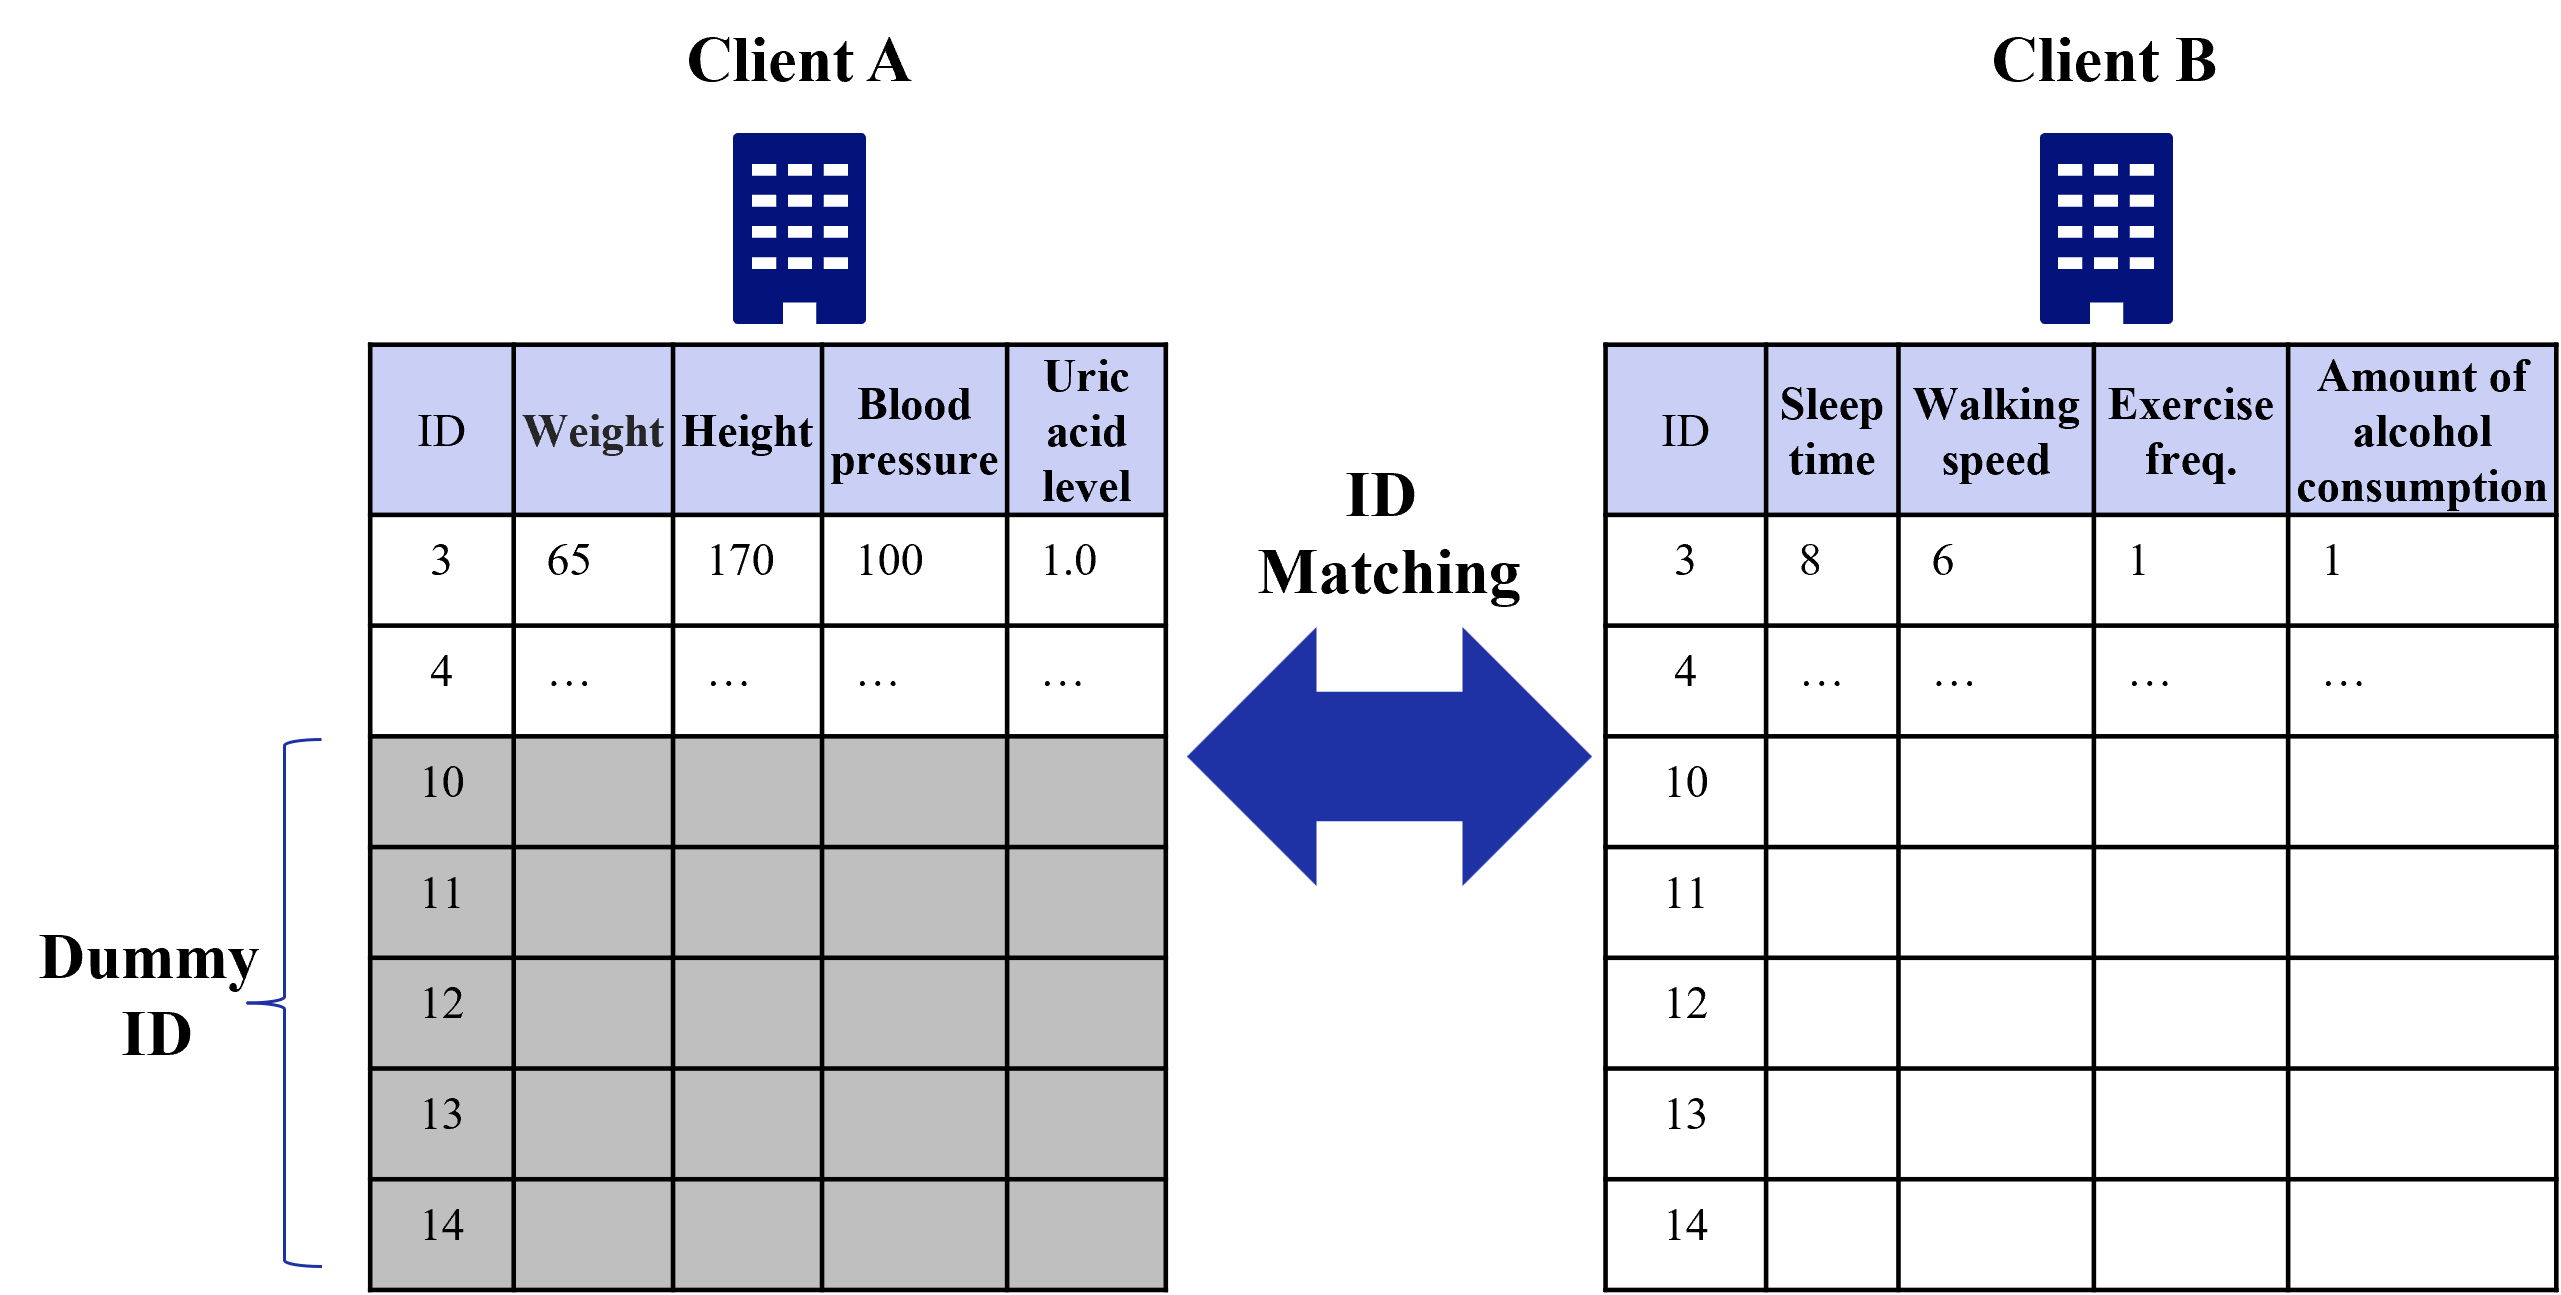
This diagram illustrates a data matching process between two clients, Client A and Client B, based on a shared ID. The diagram depicts two tables representing data for each client, with an arrow indicating the matching process. The tables contain various health and lifestyle metrics.
### Components/Axes
The diagram consists of:
* **Client A Table:** Contains columns for "ID", "Weight", "Height", "Blood pressure", and "Uric acid level".
* **Client B Table:** Contains columns for "ID", "Sleep time", "Walking speed", "Exercise freq.", and "Amount of alcohol consumption".
* **Matching Arrow:** A blue, double-headed arrow pointing between the two tables, labeled "ID Matching".
* **Client A Icon:** A building icon above the Client A table.
* **Client B Icon:** A building icon above the Client B table.
* **Dummy ID Label:** A label on the left side of the diagram indicating "Dummy ID" with an associated arrow pointing to the ID column in both tables.
### Detailed Analysis or Content Details
**Client A Data:**
* **ID 3:** Weight = 65, Height = 170, Blood pressure = 100, Uric acid level = 1.0
* **ID 4:** All values are represented by "...".
* **ID 10-14:** All values are represented by "...".
**Client B Data:**
* **ID 3:** Sleep time = 8, Walking speed = 6, Exercise freq. = 1, Amount of alcohol consumption = 1
* **ID 4:** All values are represented by "...".
* **ID 10-14:** All values are represented by "...".
The "ID Matching" arrow indicates that the tables are linked based on the "ID" column. The diagram shows that only ID 3 has complete data for both clients. The remaining IDs (4, 10, 11, 12, 13, 14) have incomplete data represented by "...".
### Key Observations
* The diagram highlights the importance of a common identifier ("ID") for matching data between different sources (Client A and Client B).
* The use of "..." indicates missing or unavailable data for most IDs.
* Only one ID (ID 3) has complete data across both clients.
* The data types are mixed (numerical and potentially categorical).
### Interpretation
The diagram demonstrates a scenario where data from two different clients is being integrated or compared. The "ID" serves as the key for linking the records. The presence of "..." suggests data gaps or privacy concerns, where certain information is not shared or available. The diagram likely represents a simplified view of a data integration process, potentially in a healthcare or research context. The matching process is focused on identifying corresponding records based on the ID, which is crucial for accurate analysis and decision-making. The limited data available for most IDs suggests that data collection or sharing may be incomplete or restricted. The diagram implies a need for data cleaning and validation to ensure the quality and reliability of the integrated dataset.