## Bar Chart: Success Rate vs. Average Interaction Turns for Different Models
### Overview
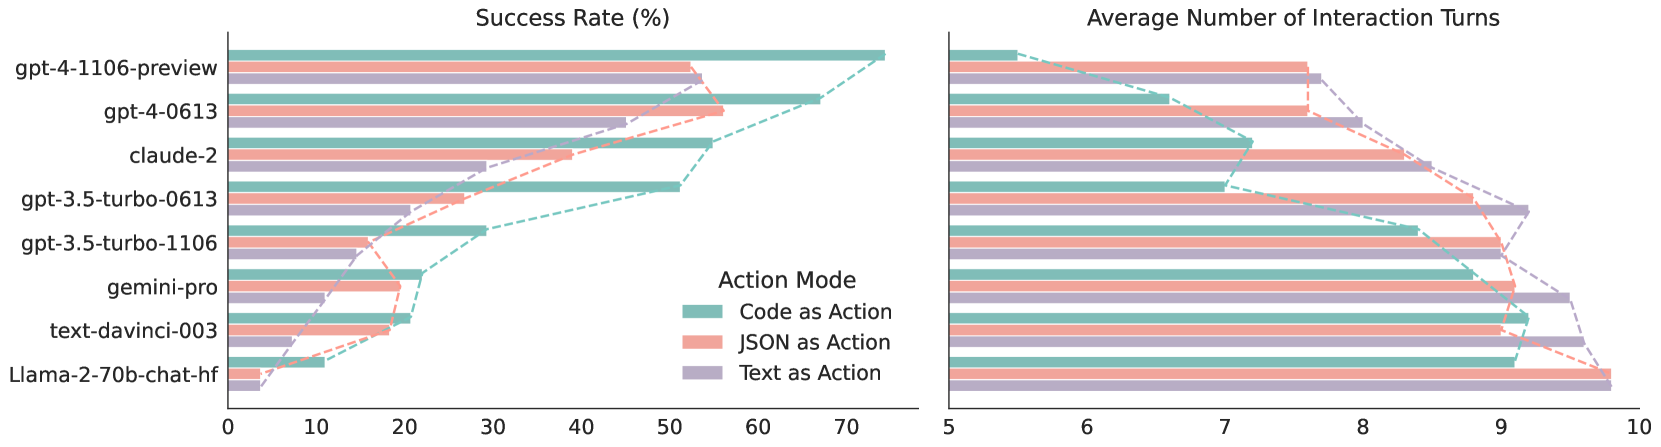
The image presents two horizontal bar charts comparing the success rate (in percentage) and the average number of interaction turns for various language models. The models are evaluated under three different action modes: "Code as Action", "JSON as Action", and "Text as Action". The charts allow for a comparison of model performance across these different action modes.
### Components/Axes
**Left Chart: Success Rate (%)**
* **Title:** Success Rate (%)
* **X-axis:** Success Rate (%), with scale from 0 to 70 in increments of 10.
* **Y-axis:** Language Models (listed vertically):
* gpt-4-1106-preview
* gpt-4-0613
* claude-2
* gpt-3.5-turbo-0613
* gpt-3.5-turbo-1106
* gemini-pro
* text-davinci-003
* Llama-2-70b-chat-hf
* **Legend (located between the two charts):**
* Code as Action (teal)
* JSON as Action (light red/pink)
* Text as Action (light purple)
**Right Chart: Average Number of Interaction Turns**
* **Title:** Average Number of Interaction Turns
* **X-axis:** Average Number of Interaction Turns, with scale from 5 to 10 in increments of 1.
* **Y-axis:** Same Language Models as the left chart (listed vertically).
* **Legend:** Same as the left chart.
### Detailed Analysis
**Left Chart: Success Rate (%)**
* **gpt-4-1106-preview:**
* Code as Action: ~70%
* JSON as Action: ~65%
* Text as Action: ~65%
* **gpt-4-0613:**
* Code as Action: ~55%
* JSON as Action: ~50%
* Text as Action: ~50%
* **claude-2:**
* Code as Action: ~50%
* JSON as Action: ~30%
* Text as Action: ~40%
* **gpt-3.5-turbo-0613:**
* Code as Action: ~50%
* JSON as Action: ~20%
* Text as Action: ~30%
* **gpt-3.5-turbo-1106:**
* Code as Action: ~30%
* JSON as Action: ~20%
* Text as Action: ~20%
* **gemini-pro:**
* Code as Action: ~20%
* JSON as Action: ~15%
* Text as Action: ~15%
* **text-davinci-003:**
* Code as Action: ~15%
* JSON as Action: ~10%
* Text as Action: ~10%
* **Llama-2-70b-chat-hf:**
* Code as Action: ~10%
* JSON as Action: ~5%
* Text as Action: ~5%
**Right Chart: Average Number of Interaction Turns**
* **gpt-4-1106-preview:**
* Code as Action: ~6
* JSON as Action: ~7
* Text as Action: ~7
* **gpt-4-0613:**
* Code as Action: ~7
* JSON as Action: ~7.5
* Text as Action: ~7.5
* **claude-2:**
* Code as Action: ~7.5
* JSON as Action: ~8
* Text as Action: ~8
* **gpt-3.5-turbo-0613:**
* Code as Action: ~7.5
* JSON as Action: ~9
* Text as Action: ~8.5
* **gpt-3.5-turbo-1106:**
* Code as Action: ~8.5
* JSON as Action: ~9
* Text as Action: ~9
* **gemini-pro:**
* Code as Action: ~9
* JSON as Action: ~9.5
* Text as Action: ~9.5
* **text-davinci-003:**
* Code as Action: ~9.5
* JSON as Action: ~9.5
* Text as Action: ~9.5
* **Llama-2-70b-chat-hf:**
* Code as Action: ~9.5
* JSON as Action: ~9.5
* Text as Action: ~9.5
### Key Observations
* **Success Rate:** gpt-4-1106-preview consistently shows the highest success rate across all action modes. Llama-2-70b-chat-hf has the lowest success rate.
* **Interaction Turns:** The average number of interaction turns generally increases as the success rate decreases. Llama-2-70b-chat-hf, text-davinci-003, and gemini-pro require more interaction turns on average.
* **Action Mode Impact:** The "Code as Action" mode generally results in higher success rates compared to "JSON as Action" and "Text as Action" for most models.
### Interpretation
The charts suggest a trade-off between success rate and the number of interaction turns required. Models with higher success rates (like gpt-4-1106-preview) tend to achieve their goals with fewer interaction turns, indicating greater efficiency. The choice of action mode also significantly impacts performance, with "Code as Action" often leading to better success rates. This could be because code provides a more structured and unambiguous way for the models to interact with the environment. The data highlights the strengths and weaknesses of different language models in various interaction scenarios, providing valuable insights for developers and users.