TECHNICAL ASSET FINGERPRINT
10a89a348cbfede949bc6f01
Click to view fullscreen
Press ESC or click to close
FOUND IN PAPERS
EXPERT: gemini-3.1-pro-preview VERSION 1
RUNTIME: gemini/gemini-3.1-pro-preview
INTEL_VERIFIED
## Dual Horizontal Bar Charts: LLM Performance by Action Mode
### Overview
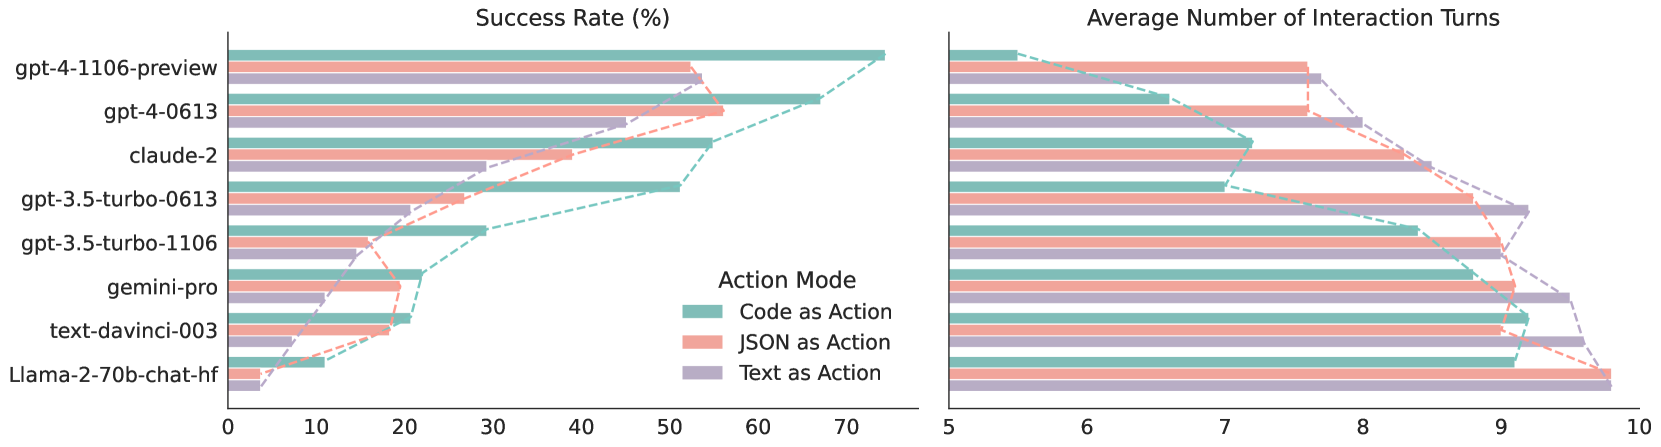
The image displays two side-by-side horizontal bar charts comparing the performance of eight different Large Language Models (LLMs) across three distinct "Action Modes." The left chart measures the "Success Rate (%)", while the right chart measures the "Average Number of Interaction Turns." Dashed trend lines connect the endpoints of the bars for each respective action mode across the different models, visually emphasizing the performance hierarchy.
### Components/Axes
**Spatial Grounding & Layout:**
* **Left Chart (Success Rate):** Occupies the left half of the image.
* **Right Chart (Interaction Turns):** Occupies the right half of the image.
* **Y-Axis (Shared visually, labeled on the far left):** Lists eight LLM models, ordered generally from highest performing at the top to lowest performing at the bottom.
* Labels (Top to Bottom): `gpt-4-1106-preview`, `gpt-4-0613`, `claude-2`, `gpt-3.5-turbo-0613`, `gpt-3.5-turbo-1106`, `gemini-pro`, `text-davinci-003`, `Llama-2-70b-chat-hf`.
* **Left Chart X-Axis:** Labeled "Success Rate (%)". Located at the bottom of the left chart. Scale ranges from 0 to 70, with major tick marks at intervals of 10 (0, 10, 20, 30, 40, 50, 60, 70). The axis line extends slightly past 70 to accommodate data up to approximately 75.
* **Right Chart X-Axis:** Labeled "Average Number of Interaction Turns". Located at the bottom of the right chart. Scale ranges from 5 to 10, with major tick marks at intervals of 1 (5, 6, 7, 8, 9, 10).
* **Legend:** Located in the bottom-right quadrant of the left chart's plotting area.
* Title: "Action Mode"
* Teal (light green/blue) square: `Code as Action`
* Salmon (light red/orange) square: `JSON as Action`
* Purple (light lavender) square: `Text as Action`
### Detailed Analysis & Content Details
#### Trend Verification
* **Left Chart (Success Rate):** The dashed lines connecting the bar ends slope downwards from top to bottom. This indicates that as we move down the list of models, the success rate generally decreases across all action modes. Furthermore, the Teal line (Code) is consistently positioned furthest to the right (highest success), followed by Salmon (JSON), and then Purple (Text) furthest to the left, with minor exceptions.
* **Right Chart (Interaction Turns):** The dashed lines slope upwards from top to bottom (moving left to right on the x-axis). This indicates that as we move down the list of models, the number of interaction turns required generally increases. The Teal line (Code) is consistently positioned furthest to the left (fewest turns), followed by Salmon (JSON), and Purple (Text) furthest to the right (most turns), again with minor exceptions.
#### Reconstructed Data Table
*Note: Values are visually approximated from the charts with an estimated margin of error of ±1 unit.*
| Model (Y-Axis) | Action Mode | Success Rate (%) (Left Chart) | Avg. Interaction Turns (Right Chart) |
| :--- | :--- | :--- | :--- |
| **gpt-4-1106-preview** | Code (Teal) | ~ 74 | ~ 5.5 |
| | JSON (Salmon) | ~ 52 | ~ 7.6 |
| | Text (Purple) | ~ 54 | ~ 7.7 |
| **gpt-4-0613** | Code (Teal) | ~ 67 | ~ 6.6 |
| | JSON (Salmon) | ~ 56 | ~ 7.6 |
| | Text (Purple) | ~ 45 | ~ 8.0 |
| **claude-2** | Code (Teal) | ~ 55 | ~ 7.2 |
| | JSON (Salmon) | ~ 39 | ~ 8.5 |
| | Text (Purple) | ~ 29 | ~ 8.7 |
| **gpt-3.5-turbo-0613** | Code (Teal) | ~ 51 | ~ 7.0 |
| | JSON (Salmon) | ~ 27 | ~ 8.8 |
| | Text (Purple) | ~ 21 | ~ 9.2 |
| **gpt-3.5-turbo-1106** | Code (Teal) | ~ 29 | ~ 8.4 |
| | JSON (Salmon) | ~ 19 | ~ 9.0 |
| | Text (Purple) | ~ 15 | ~ 9.0 |
| **gemini-pro** | Code (Teal) | ~ 22 | ~ 8.8 |
| | JSON (Salmon) | ~ 20 | ~ 9.1 |
| | Text (Purple) | ~ 10 | ~ 9.5 |
| **text-davinci-003** | Code (Teal) | ~ 21 | ~ 9.2 |
| | JSON (Salmon) | ~ 18 | ~ 9.0 |
| | Text (Purple) | ~ 7 | ~ 9.6 |
| **Llama-2-70b-chat-hf** | Code (Teal) | ~ 11 | ~ 9.1 |
| | JSON (Salmon) | ~ 4 | ~ 9.8 |
| | Text (Purple) | ~ 4 | ~ 9.8 |
### Key Observations
1. **Dominance of "Code as Action":** Across almost all models, "Code as Action" (Teal) yields the highest success rate and requires the fewest interaction turns. The gap between Code and the other modes is particularly pronounced in the top-performing models (GPT-4 variants and Claude-2).
2. **Inverse Correlation:** There is a clear inverse relationship between the two charts. Models and action modes that achieve high success rates (bars extending far to the right on the left chart) correspond to lower average interaction turns (bars ending further to the left on the right chart).
3. **Model Hierarchy:** The GPT-4 models significantly outperform the rest of the pack in success rate, particularly when using Code as Action. Open-source/smaller models like Llama-2-70b struggle significantly, with success rates near zero for JSON and Text modes.
4. **Anomalies/Exceptions:**
* For `gpt-4-1106-preview`, "Text as Action" (~54%) slightly outperforms "JSON as Action" (~52%) in success rate, which breaks the general trend of JSON > Text.
* For `text-davinci-003`, "JSON as Action" (~9.0 turns) requires slightly fewer turns than "Code as Action" (~9.2 turns), breaking the general trend of Code requiring the fewest turns.
### Interpretation
This data visualizes a benchmark comparing how different LLMs handle agentic tasks or tool use depending on the output format they are instructed to use ("Action Mode").
**Peircean Investigative Analysis:**
* **The Superiority of Code:** The data strongly suggests that LLMs are inherently better at reasoning and executing actions when framing their outputs as executable code (likely Python) rather than structured data (JSON) or natural language (Text). This is likely because code generation benefits from strict syntax rules, deterministic execution environments, and the vast amount of code present in the models' training data, which inherently contains logical step-by-step problem-solving structures.
* **Interaction Turns as a Proxy for Struggle:** The "Average Number of Interaction Turns" metric serves as a proxy for model efficiency and error-correction. A higher number of turns indicates that the model failed its initial attempt, received an error message or feedback, and had to try again multiple times. The fact that lower success rates correlate with higher turns implies that weaker models (or weaker action modes) get stuck in loops of failing, retrying, and failing again, eventually hitting a turn limit or failing entirely.
* **The "JSON" Middle Ground:** JSON generally performs better than plain text but worse than code. This indicates that while enforcing a structured schema (JSON) helps the model organize its thoughts better than free-form text, it lacks the inherent logical execution flow that code provides.
* **Evolution of Models:** The chart clearly shows generational leaps. `gpt-4-1106-preview` is vastly superior to `gpt-3.5-turbo` variants. Interestingly, `gpt-3.5-turbo-0613` shows a significantly higher success rate with Code (~51%) compared to the newer `gpt-3.5-turbo-1106` (~29%), suggesting a potential regression in specific coding/agentic capabilities between those specific minor versions, or a change in how the benchmark interacts with the newer API.
DECODING INTELLIGENCE...