TECHNICAL ASSET FINGERPRINT
10a89a348cbfede949bc6f01
Click to view fullscreen
Press ESC or click to close
FOUND IN PAPERS
EXPERT: healer-alpha-free VERSION 1
RUNTIME: free/openrouter/healer-alpha
INTEL_VERIFIED
## Dual-Axis Horizontal Bar Chart with Overlaid Line Graphs: Model Performance Comparison
### Overview
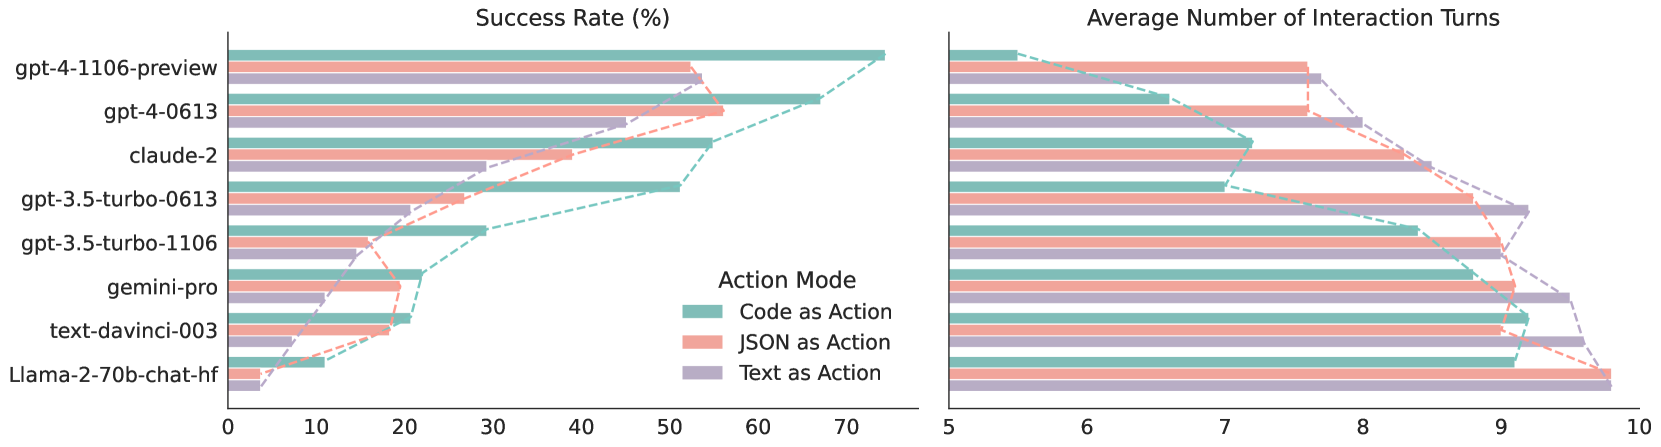
The image displays a comparative performance analysis of eight large language models (LLMs) across three different "Action Modes." The visualization consists of two side-by-side horizontal bar charts sharing a common y-axis (model names). The left chart measures "Success Rate (%)" and the right chart measures "Average Number of Interaction Turns." Overlaid on each bar chart is a dashed line graph connecting the data points for each action mode, illustrating the trend across models.
### Components/Axes
* **Y-Axis (Shared):** Lists eight LLM models from top to bottom:
1. `gpt-4-1106-preview`
2. `gpt-4-0613`
3. `claude-2`
4. `gpt-3.5-turbo-0613`
5. `gpt-3.5-turbo-1106`
6. `gemini-pro`
7. `text-davinci-003`
8. `Llama-2-70b-chat-hf`
* **Left Chart X-Axis:** "Success Rate (%)" with a scale from 0 to 70, marked at intervals of 10.
* **Right Chart X-Axis:** "Average Number of Interaction Turns" with a scale from 5 to 10, marked at intervals of 1.
* **Legend:** Positioned in the center, between the two charts. It defines the three "Action Mode" categories by color:
* **Code as Action:** Teal/Green color.
* **JSON as Action:** Salmon/Pink color.
* **Text as Action:** Lavender/Purple color.
* **Data Series:** For each model, there are three horizontal bars (one per action mode) in the left chart and three in the right chart. Dashed lines of the corresponding color connect the endpoints of the bars for each action mode across the models.
### Detailed Analysis
**Left Chart: Success Rate (%)**
*Trend Verification:* The "Code as Action" (teal) line generally sits highest, indicating the best success rates. The "JSON as Action" (pink) line is in the middle, and the "Text as Action" (purple) line is the lowest. All three lines show a general downward trend from top to bottom (from newer to older models).
* **gpt-4-1106-preview:**
* Code as Action: ~70% (highest overall)
* JSON as Action: ~53%
* Text as Action: ~53%
* **gpt-4-0613:**
* Code as Action: ~67%
* JSON as Action: ~56%
* Text as Action: ~45%
* **claude-2:**
* Code as Action: ~55%
* JSON as Action: ~38%
* Text as Action: ~29%
* **gpt-3.5-turbo-0613:**
* Code as Action: ~51%
* JSON as Action: ~27%
* Text as Action: ~21%
* **gpt-3.5-turbo-1106:**
* Code as Action: ~29%
* JSON as Action: ~19%
* Text as Action: ~15%
* **gemini-pro:**
* Code as Action: ~22%
* JSON as Action: ~19%
* Text as Action: ~11%
* **text-davinci-003:**
* Code as Action: ~21%
* JSON as Action: ~18%
* Text as Action: ~7%
* **Llama-2-70b-chat-hf:**
* Code as Action: ~11%
* JSON as Action: ~3%
* Text as Action: ~4%
**Right Chart: Average Number of Interaction Turns**
*Trend Verification:* The "Text as Action" (purple) line is consistently the highest, indicating more turns are needed. The "JSON as Action" (pink) line is in the middle, and the "Code as Action" (teal) line is the lowest, indicating greater efficiency. All three lines show a general upward trend from top to bottom, meaning older models require more interaction turns.
* **gpt-4-1106-preview:**
* Code as Action: ~5.3 turns
* JSON as Action: ~7.6 turns
* Text as Action: ~7.7 turns
* **gpt-4-0613:**
* Code as Action: ~6.6 turns
* JSON as Action: ~7.6 turns
* Text as Action: ~8.0 turns
* **claude-2:**
* Code as Action: ~7.2 turns
* JSON as Action: ~8.5 turns
* Text as Action: ~8.5 turns
* **gpt-3.5-turbo-0613:**
* Code as Action: ~7.0 turns
* JSON as Action: ~8.8 turns
* Text as Action: ~9.2 turns
* **gpt-3.5-turbo-1106:**
* Code as Action: ~8.4 turns
* JSON as Action: ~9.0 turns
* Text as Action: ~9.0 turns
* **gemini-pro:**
* Code as Action: ~8.8 turns
* JSON as Action: ~9.1 turns
* Text as Action: ~9.5 turns
* **text-davinci-003:**
* Code as Action: ~9.2 turns
* JSON as Action: ~9.0 turns
* Text as Action: ~9.6 turns
* **Llama-2-70b-chat-hf:**
* Code as Action: ~9.1 turns
* JSON as Action: ~9.8 turns
* Text as Action: ~9.8 turns
### Key Observations
1. **Clear Performance Hierarchy:** `gpt-4-1106-preview` is the top performer across all metrics, achieving the highest success rates with the fewest interaction turns.
2. **Action Mode Efficiency:** "Code as Action" is consistently the most effective mode, yielding the highest success rates and requiring the fewest interaction turns for every model tested.
3. **Inverse Correlation:** There is a strong inverse relationship between Success Rate and Interaction Turns. Models with higher success rates (like the GPT-4 variants) complete tasks in fewer turns.
4. **Model Generation Gap:** Newer model versions (e.g., `gpt-4-1106-preview` vs. `gpt-4-0613`, `gpt-3.5-turbo-1106` vs. `gpt-3.5-turbo-0613`) show improved performance in both metrics.
5. **Significant Outlier:** `Llama-2-70b-chat-hf` demonstrates substantially lower success rates (<12%) and high interaction turns (~9.1-9.8) compared to the other models in this evaluation.
### Interpretation
This data suggests a clear technical conclusion for the task or benchmark being measured: **structured, code-based outputs ("Code as Action") are significantly more reliable and efficient for LLMs to execute than natural language ("Text as Action") or semi-structured ("JSON as Action") outputs.**
The charts demonstrate that model capability (as seen in the GPT-4 series) is the primary driver of high success rates. However, the *format of the action* is a critical secondary factor that universally impacts both success and efficiency. The consistent ranking of Action Modes (Code > JSON > Text) across all models implies this is a fundamental characteristic of the task domain, not a model-specific quirk.
The visualization effectively argues that to maximize performance in this context, one should both select a capable model *and* design interactions that leverage code-based actions. The older models and the Llama-2 model struggle significantly, highlighting the rapid progress in the field and potential differences in training or architecture for this specific type of task.
DECODING INTELLIGENCE...