## Bar Chart: Model Performance by Action Mode
### Overview
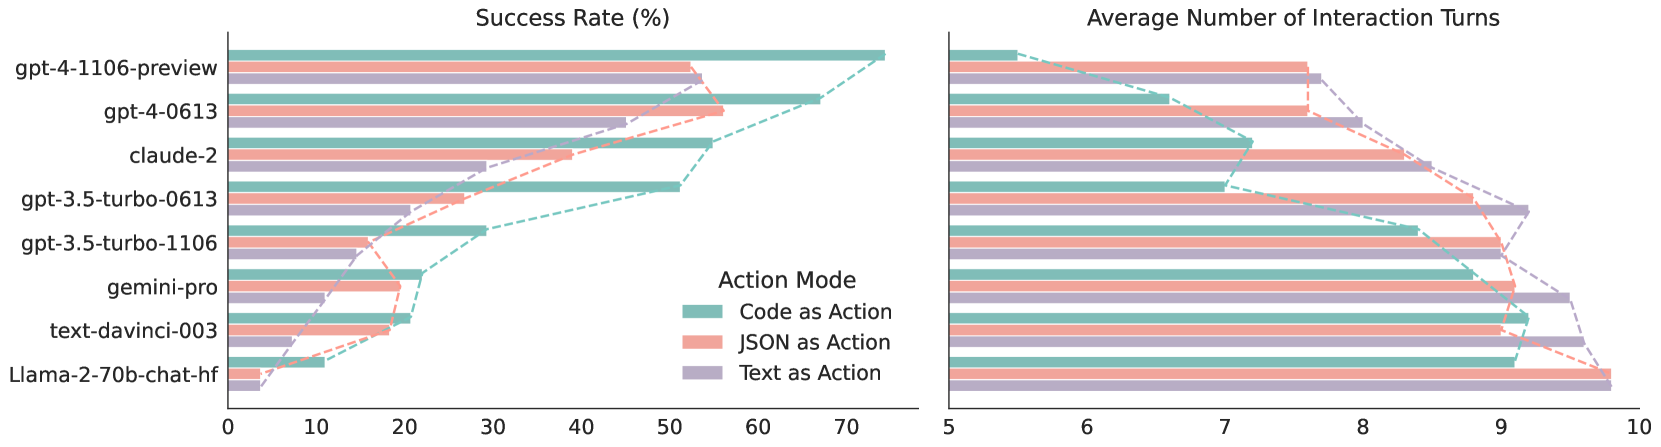
The image is a grouped bar chart comparing the performance of various AI models across three action modes: "Code as Action," "JSON as Action," and "Text as Action." Two y-axes are used: **Success Rate (%)** (left, 0–70%) and **Average Number of Interaction Turns** (right, 5–14). Models are listed vertically on the x-axis, ordered from highest to lowest performance.
### Components/Axes
- **X-Axis**: Models (e.g., `gpt-4-1106-preview`, `gpt-4-0613`, `claude-2`, `gpt-3.5-turbo-0613`, `gpt-3.5-turbo-1106`, `gemini-pro`, `text-davinci-003`, `llama-2-70b-chat-hf`).
- **Y-Axes**:
- **Left (Success Rate)**: 0–70% in 10% increments.
- **Right (Interaction Turns)**: 5–14 in 1-turn increments.
- **Legend**: Located on the right, associating colors with action modes:
- **Teal**: Code as Action
- **Orange**: JSON as Action
- **Purple**: Text as Action
- **Dashed Lines**: Connect data points for each action mode across models, indicating trends.
### Detailed Analysis
1. **Success Rate (%)**:
- **Code as Action (Teal)**:
- `gpt-4-1106-preview`: ~70%
- `gpt-4-0613`: ~65%
- `claude-2`: ~55%
- `gpt-3.5-turbo-0613`: ~45%
- `gpt-3.5-turbo-1106`: ~30%
- `gemini-pro`: ~20%
- `text-davinci-003`: ~15%
- `llama-2-70b-chat-hf`: ~5%
- **JSON as Action (Orange)**:
- `gpt-4-1106-preview`: ~55%
- `gpt-4-0613`: ~50%
- `claude-2`: ~40%
- `gpt-3.5-turbo-0613`: ~35%
- `gpt-3.5-turbo-1106`: ~25%
- `gemini-pro`: ~15%
- `text-davinci-003`: ~10%
- `llama-2-70b-chat-hf`: ~10%
- **Text as Action (Purple)**:
- `gpt-4-1106-preview`: ~50%
- `gpt-4-0613`: ~45%
- `claude-2`: ~35%
- `gpt-3.5-turbo-0613`: ~30%
- `gpt-3.5-turbo-1106`: ~20%
- `gemini-pro`: ~10%
- `text-davinci-003`: ~5%
- `llama-2-70b-chat-hf`: ~15%
2. **Average Interaction Turns**:
- **Code as Action (Teal)**:
- `gpt-4-1106-preview`: ~5.5
- `gpt-4-0613`: ~6
- `claude-2`: ~7
- `gpt-3.5-turbo-0613`: ~8
- `gpt-3.5-turbo-1106`: ~9
- `gemini-pro`: ~10
- `text-davinci-003`: ~11
- `llama-2-70b-chat-hf`: ~12
- **JSON as Action (Orange)**:
- `gpt-4-1106-preview`: ~6.5
- `gpt-4-0613`: ~7
- `claude-2`: ~8
- `gpt-3.5-turbo-0613`: ~9
- `gpt-3.5-turbo-1106`: ~10
- `gemini-pro`: ~11
- `text-davinci-003`: ~12
- `llama-2-70b-chat-hf`: ~13
- **Text as Action (Purple)**:
- `gpt-4-1106-preview`: ~7
- `gpt-4-0613`: ~8
- `claude-2`: ~9
- `gpt-3.5-turbo-0613`: ~10
- `gpt-3.5-turbo-1106`: ~11
- `gemini-pro`: ~12
- `text-davinci-003`: ~13
- `llama-2-70b-chat-hf`: ~14
### Key Observations
- **Inverse Relationship**: Success rate decreases as interaction turns increase across all models.
- **Code as Action Dominance**: Teal bars (Code as Action) consistently show the highest success rates and lowest interaction turns.
- **Text as Action Trade-off**: Purple bars (Text as Action) have the lowest success rates but highest interaction turns, suggesting a potential trade-off between efficiency and thoroughness.
- **Model Hierarchy**: Models are ordered from top (best) to bottom (worst), with `gpt-4-1106-preview` leading and `llama-2-70b-chat-hf` trailing.
### Interpretation
The chart highlights a clear trade-off between **efficiency** (success rate) and **interaction depth** (turns). Models using **Code as Action** achieve higher success rates with fewer turns, making them ideal for tasks requiring precision and speed. Conversely, **Text as Action** models, while less efficient, may excel in complex, iterative tasks requiring detailed dialogue. The dashed trend lines reinforce this pattern, showing a consistent decline in success rate and rise in interaction turns as models degrade in performance. This suggests that action mode choice critically impacts model utility depending on the use case.