## Bar Charts: Difference at Varying Temperatures
### Overview
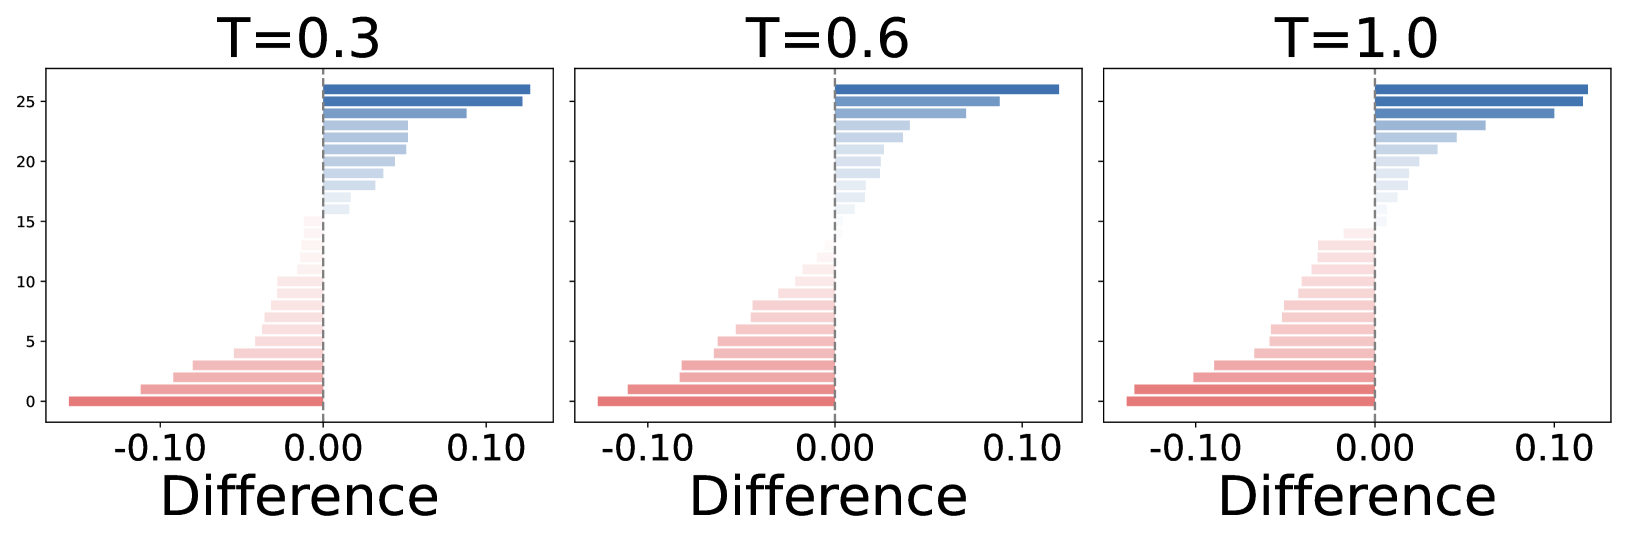
The image presents three bar charts, each displaying the "Difference" along the x-axis and an unspecified quantity along the y-axis. The charts are distinguished by the temperature values: T=0.3, T=0.6, and T=1.0. The bars are colored in a gradient from red to blue, with red bars representing negative differences and blue bars representing positive differences.
### Components/Axes
* **X-axis:** "Difference", ranging from approximately -0.10 to 0.10.
* **Y-axis:** Numerical scale from 0 to 25, with increments of 5.
* **Titles:** T=0.3 (left), T=0.6 (center), T=1.0 (right).
* **Bar Colors:** Gradient from red (negative values) to blue (positive values).
* A vertical dashed line is present at x=0 on each chart.
### Detailed Analysis
Each chart contains a series of horizontal bars, with the length of each bar corresponding to the "Difference" value. The bars are arranged vertically, with the red bars (negative differences) located below the x-axis and the blue bars (positive differences) located above the x-axis.
**Chart 1: T=0.3**
* The bars on the negative side (red) range from approximately -0.10 to -0.02.
* The bars on the positive side (blue) range from approximately 0.02 to 0.12.
* The y-axis values corresponding to the bars appear to be evenly spaced from 0 to 25.
**Chart 2: T=0.6**
* The bars on the negative side (red) range from approximately -0.10 to -0.02.
* The bars on the positive side (blue) range from approximately 0.02 to 0.12.
* The y-axis values corresponding to the bars appear to be evenly spaced from 0 to 25.
**Chart 3: T=1.0**
* The bars on the negative side (red) range from approximately -0.10 to -0.02.
* The bars on the positive side (blue) range from approximately 0.02 to 0.12.
* The y-axis values corresponding to the bars appear to be evenly spaced from 0 to 25.
### Key Observations
* The distribution of "Difference" values appears similar across all three temperature settings.
* The bars are symmetrically distributed around the x=0 line.
* The bars on the positive side (blue) are slightly longer than the bars on the negative side (red).
### Interpretation
The charts illustrate the distribution of "Difference" values at different temperatures (T=0.3, T=0.6, T=1.0). The data suggests that the temperature does not significantly impact the distribution of these differences. The slight asymmetry, with positive differences being slightly larger, indicates a potential bias or trend towards positive values. The y-axis is not labeled, so the meaning of the vertical position of each bar is unclear. It could represent frequency, magnitude, or another relevant variable.