\n
## Horizontal Diverging Bar Charts: Temperature-Dependent Difference Distributions
### Overview
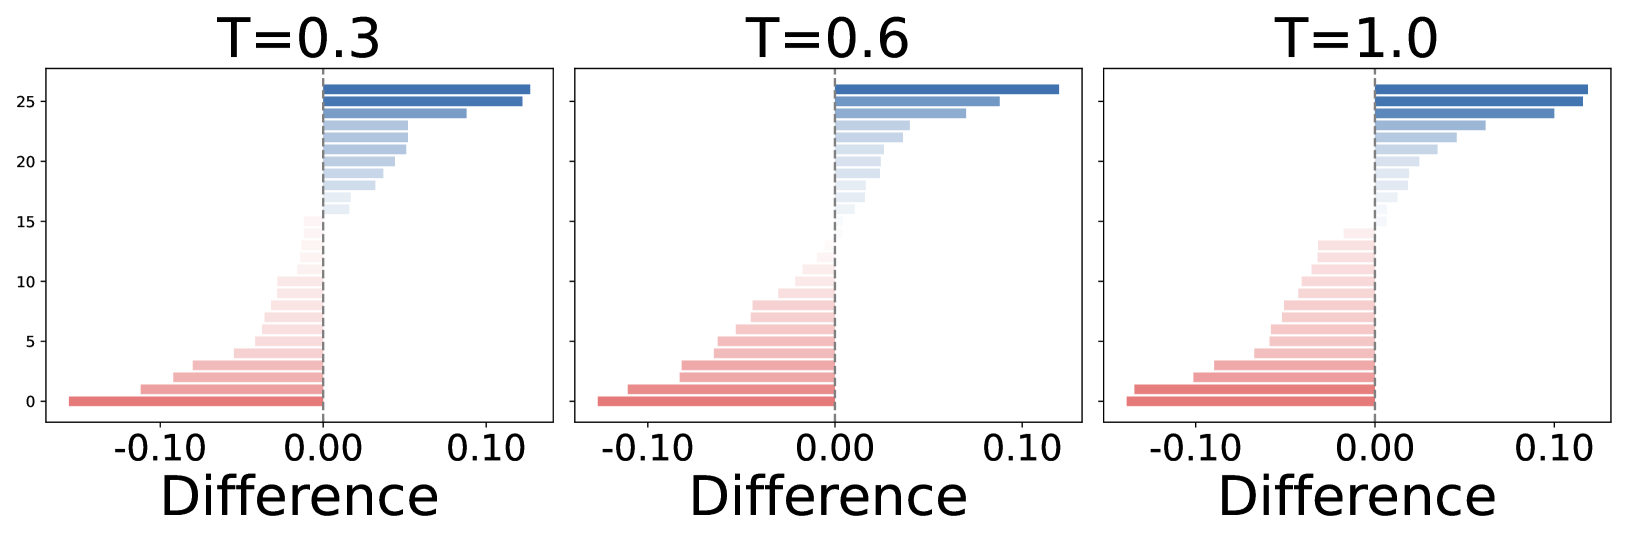
The image displays three horizontally aligned diverging bar charts, each representing the distribution of a "Difference" metric at a specific temperature (T). The charts are arranged side-by-side, showing how the distribution of differences changes as the temperature parameter increases from 0.3 to 1.0. Each chart contains approximately 25-30 horizontal bars, stacked vertically, with their length and direction (left/right) representing the magnitude and sign of the difference value.
### Components/Axes
* **Titles:** Each subplot has a title at the top center: "T=0.3", "T=0.6", and "T=1.0".
* **X-Axis (Common to all):**
* **Label:** "Difference" (centered below each subplot).
* **Scale:** Linear scale ranging from approximately -0.14 to +0.14.
* **Major Tick Marks:** Labeled at -0.10, 0.00, and 0.10.
* **Reference Line:** A vertical dashed line at x=0.00 serves as the central divider between negative and positive values.
* **Y-Axis (Implied):**
* **Scale:** Ordinal or categorical, with bars stacked from bottom (index ~0) to top (index ~25).
* **Tick Marks:** Numerical markers are present at intervals of 5 (0, 5, 10, 15, 20, 25), but no categorical labels are provided for the individual bars.
* **Color Legend (Implicit):**
* **Negative Values (Left of center):** A gradient from deep red (most negative) to light pink/white (near zero).
* **Positive Values (Right of center):** A gradient from deep blue (most positive) to light blue/white (near zero).
* **Spatial Grounding:** The color intensity directly correlates with the magnitude of the difference from zero. The longest red bar is at the bottom of each chart, and the longest blue bar is at the top.
### Detailed Analysis
**Trend Verification per Chart:**
1. **T=0.3 (Left Chart):**
* **Negative Side (Red):** Shows a pronounced, long-tailed distribution. The longest bar (bottom) extends to approximately -0.13. The bars gradually shorten as they approach the center, with the last few bars being very short and light pink.
* **Positive Side (Blue):** Shows a shorter, more compressed distribution. The longest bar (top) extends to approximately +0.12. The bars shorten rapidly towards the center.
* **Overall Shape:** Asymmetric, with a heavier concentration of larger magnitude differences on the negative side.
2. **T=0.6 (Middle Chart):**
* **Negative Side (Red):** The distribution has contracted. The longest bar now extends to approximately -0.11. The overall length of the red section is shorter than at T=0.3.
* **Positive Side (Blue):** The distribution has expanded. The longest bar now extends to approximately +0.13. The blue section is longer and contains more bars of significant length compared to T=0.3.
* **Overall Shape:** More balanced than T=0.3, but still shows a slight skew toward positive values in terms of the number of bars with substantial length.
3. **T=1.0 (Right Chart):**
* **Negative Side (Red):** Further contraction. The longest bar extends to approximately -0.09. The red section is the shortest of the three charts.
* **Positive Side (Blue):** Further expansion. The longest bar extends to approximately +0.14. The blue section is the longest and most prominent of the three charts.
* **Overall Shape:** Clearly skewed toward positive differences. The positive (blue) bars dominate the upper half of the chart in both number and magnitude.
**Data Point Extraction (Approximate Maxima):**
| Temperature | Max Negative Difference (Approx.) | Max Positive Difference (Approx.) |
| :--- | :--- | :--- |
| T=0.3 | -0.13 | +0.12 |
| T=0.6 | -0.11 | +0.13 |
| T=1.0 | -0.09 | +0.14 |
### Key Observations
1. **Systematic Shift:** There is a clear, systematic shift in the distribution of differences as temperature (T) increases. The negative (red) tail shrinks, and the positive (blue) tail grows.
2. **Magnitude Crossover:** The maximum positive difference surpasses the maximum negative difference between T=0.3 and T=0.6. At T=0.3, the largest negative magnitude is greater; at T=0.6 and T=1.0, the largest positive magnitude is greater.
3. **Bar Count Consistency:** The total number of bars (data points) appears consistent across all three charts (~25-30), suggesting the same set of items or conditions is being measured at different temperatures.
4. **Color-Value Correlation:** The color gradient is applied consistently and accurately reflects the value: deep red for the most negative, deep blue for the most positive, and white/light shades for values near zero.
### Interpretation
This visualization demonstrates a **temperature-dependent bias or shift** in the measured "Difference" metric. The data suggests that the underlying process or system being measured is sensitive to the parameter T.
* **At low temperature (T=0.3):** The system exhibits a bias toward negative differences. This could indicate a preference for a certain state, a reduction in a measured property, or an inhibitory effect under cooler conditions.
* **As temperature increases (T=0.6 to T=1.0):** This negative bias diminishes and reverses into a positive bias. The system's output or state shifts toward producing positive differences.
* **Potential Contexts:** This pattern is common in scientific contexts such as:
* **Material Science:** Phase transitions where a property (e.g., electrical conductivity, order parameter) changes sign with temperature.
* **Chemistry/Biochemistry:** Reaction yields or enzyme activity shifting from inhibition to activation with temperature.
* **Machine Learning:** The "Difference" could represent a change in model performance or output distribution when a temperature parameter (used in sampling or loss functions) is varied. The shift from negative to positive differences would indicate a fundamental change in model behavior.
The absence of y-axis category labels is a significant limitation, preventing identification of *which* specific items are most affected by the temperature change. However, the trend is unequivocal: **increasing T systematically promotes positive differences and suppresses negative ones.**