\n
## Chart: Cumulative Accidents vs. Run Length over Time
### Overview
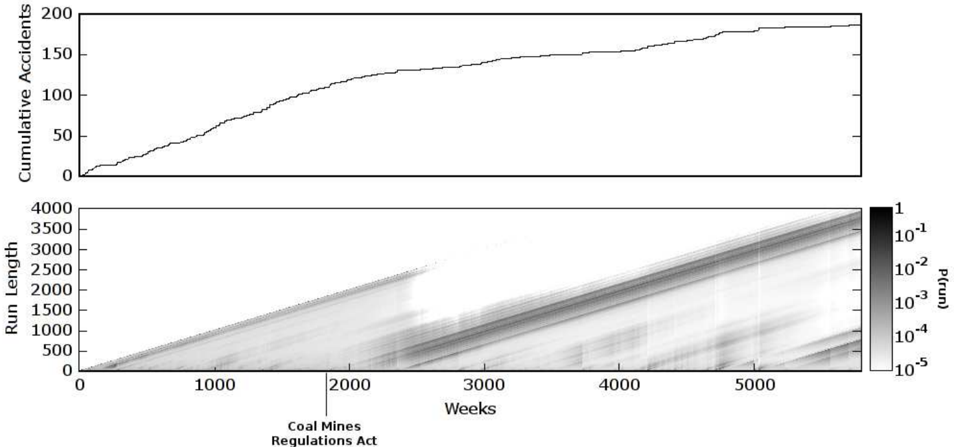
The image presents a combined chart visualizing the relationship between cumulative accidents, run length, and time (in weeks) in coal mines, likely following the implementation of the Coal Mines Regulations Act. The chart consists of a line graph showing cumulative accidents over time, and a heatmap illustrating run length as a function of weeks, with color intensity representing the probability density (Pr(um)).
### Components/Axes
* **Top Chart (Line Graph):**
* X-axis: Weeks (ranging from 0 to approximately 5500)
* Y-axis: Cumulative Accidents (ranging from 0 to approximately 200)
* Data Series: A single dark-blue line representing cumulative accidents.
* **Bottom Chart (Heatmap):**
* X-axis: Weeks (ranging from 0 to approximately 5500)
* Y-axis: Run Length (ranging from 0 to approximately 4000)
* Color Scale (right side): Probability Density (Pr(um)) on a logarithmic scale from 10<sup>-5</sup> to 1.
* **Text Label (bottom-center):** "Coal Mines Regulations Act"
### Detailed Analysis or Content Details
**Top Chart (Cumulative Accidents):**
The dark-blue line representing cumulative accidents exhibits a generally upward trend, indicating an increasing number of accidents over time. The slope of the line is steeper in the initial period (0-1000 weeks) and gradually flattens out as time progresses.
* At approximately 500 weeks, the cumulative accidents are around 75.
* At approximately 2000 weeks, the cumulative accidents are around 120.
* At approximately 5000 weeks, the cumulative accidents are around 170.
**Bottom Chart (Heatmap - Run Length vs. Weeks):**
The heatmap displays a gradient of gray shades representing the probability density of run length at different weeks.
* The heatmap shows a generally increasing trend in run length with increasing weeks.
* The darkest shades (highest probability density, around Pr(um) = 1) are concentrated in the upper-right corner of the heatmap (high run length and high weeks).
* The lightest shades (lowest probability density, around Pr(um) = 10<sup>-5</sup>) are concentrated in the lower-left corner (low run length and low weeks).
* There are several darker bands running diagonally across the heatmap, suggesting periods where certain run lengths were more common.
* The heatmap shows a relatively uniform distribution of run lengths in the early weeks (0-1000 weeks), with a gradual increase in the range of run lengths as weeks progress.
* The heatmap shows a concentration of run lengths between 1000 and 2500 for weeks between 2000 and 5000.
### Key Observations
* The cumulative accident rate increases over time, but the rate of increase slows down.
* Run length generally increases with time, indicating that mines are operating for longer periods.
* The probability density of run length varies over time, suggesting that certain periods are associated with specific run length distributions.
* The heatmap shows a positive correlation between weeks and run length.
### Interpretation
The data suggests that while the Coal Mines Regulations Act may have been implemented to improve safety, the cumulative number of accidents still increased over time, albeit at a decreasing rate. This could indicate that the regulations were partially effective in mitigating accident risk, but further improvements were needed. The increasing run length suggests that mines were becoming more efficient or were operating for longer durations, potentially due to technological advancements or economic factors. The heatmap provides insights into the distribution of run lengths over time, revealing periods where certain run lengths were more prevalent. The diagonal bands in the heatmap could represent specific operational cycles or changes in mining practices. The logarithmic scale of the probability density highlights the relative rarity of shorter run lengths at later weeks.
The combination of the line graph and heatmap provides a comprehensive view of the safety and operational characteristics of coal mines over time, allowing for a deeper understanding of the impact of the Coal Mines Regulations Act and the evolving dynamics of the mining industry.