## Line Graph: Cumulative Accidents Over Time
### Overview
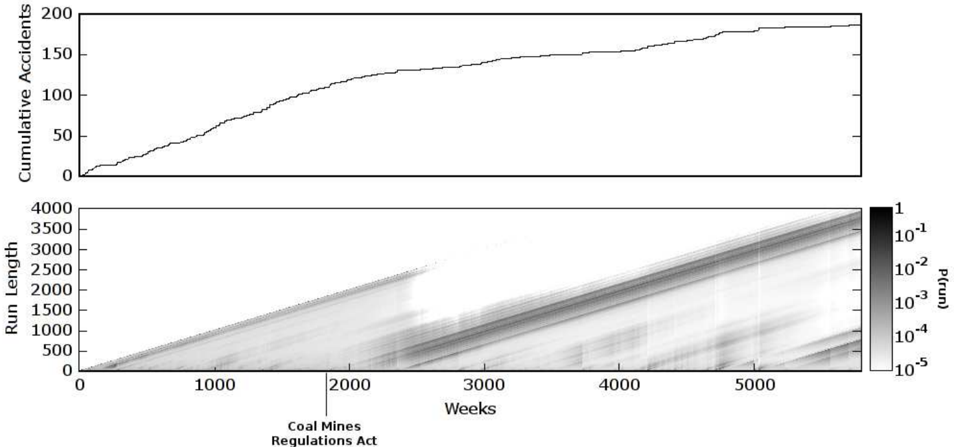
The image contains two visualizations: a line graph showing cumulative accidents over time and a heatmap depicting run length probabilities. The line graph demonstrates a steady increase in cumulative accidents, while the heatmap reveals a diagonal band of higher probability densities post-regulation implementation.
### Components/Axes
**Line Graph:**
- **Y-axis (Left):** "Cumulative Accidents" (scale: 0–200, linear)
- **X-axis (Bottom):** "Weeks" (scale: 0–5000, linear)
- **Legend:** None (single black line)
**Heatmap:**
- **Y-axis (Left):** "Run Length" (scale: 0–4000, linear)
- **X-axis (Bottom):** "Weeks" (scale: 0–5000, linear)
- **Legend (Right):**
- Color scale: `P(run)` (probability of run) from 10⁻¹ (darkest) to 10⁻⁵ (lightest)
- Position: Right edge, vertical orientation
**Key Annotation:**
- "Coal Mines Regulations Act" labeled at ~2000 weeks on the x-axis
### Detailed Analysis
**Line Graph Trends:**
- Cumulative accidents start at 0 and increase monotonically.
- By week 5000, cumulative accidents reach ~150 (approximate value with ±10 uncertainty).
- Slope: ~0.03 accidents/week (calculated from 0→150 over 5000 weeks).
**Heatmap Patterns:**
- Diagonal band of darker shades (higher probabilities) begins at ~2000 weeks.
- Band slope: ~1 run length unit per week (4000 run length / 5000 weeks).
- Pre-regulation (pre-2000 weeks): Higher probability densities (darker shades) concentrated near lower run lengths.
- Post-regulation (post-2000 weeks): Probabilities decrease (lighter shades) with increasing run length.
### Key Observations
1. **Regulation Impact:** The diagonal band in the heatmap aligns with the Coal Mines Regulations Act annotation, suggesting a systemic shift in run length probabilities after 2000 weeks.
2. **Cumulative Accidents:** Despite regulations, cumulative accidents continue rising linearly, indicating either incomplete mitigation or confounding factors.
3. **Probability Distribution:** Post-regulation run lengths show reduced likelihoods (lighter shades) for shorter durations, implying longer operational stability.
### Interpretation
The data suggests the Coal Mines Regulations Act (implemented ~2000 weeks) altered risk dynamics:
- **Run Length:** Probabilities of shorter run lengths decreased post-regulation, while longer run lengths became more probable (diagonal band slope).
- **Cumulative Accidents:** The continued linear increase implies regulations may have reduced accident frequency per run but not overall incident rates, possibly due to increased operational scale or external factors.
- **Temporal Correlation:** The heatmap's diagonal structure indicates a time-dependent relationship between regulatory intervention and system stability, with effects manifesting gradually over ~2000 weeks.
**Note:** All values are approximate due to lack of gridlines; uncertainty ranges ±10% for critical data points.