## Diagram: Bias in Machine Learning Models
### Overview
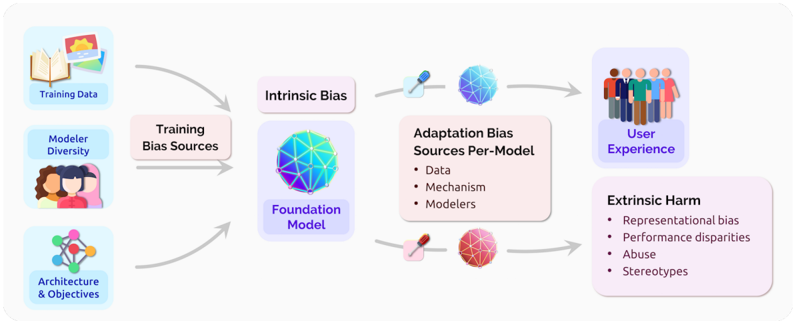
The image is a diagram illustrating the sources and flow of bias in machine learning models, from training data to user experience and potential harm. It shows how bias can originate from various stages, including training data, model architecture, and adaptation processes, ultimately affecting users.
### Components/Axes
The diagram consists of the following key components:
1. **Training Data:** Represented by an image of books and photos.
2. **Modeler Diversity:** Represented by a group of diverse people.
3. **Architecture & Objectives:** Represented by a network diagram.
4. **Training Bias Sources:** A rectangular box connecting the above three components.
5. **Intrinsic Bias:** A rectangular box above the Foundation Model.
6. **Foundation Model:** Represented by a blue and purple geometric sphere.
7. **Adaptation Bias Sources Per-Model:** A rectangular box with the following bullet points:
* Data
* Mechanism
* Modelers
8. **User Experience:** Represented by a group of people.
9. **Extrinsic Harm:** A rectangular box with the following bullet points:
* Representational bias
* Performance disparities
* Abuse
* Stereotypes
### Detailed Analysis or Content Details
* **Left Side (Input):**
* **Training Data:** Images of books and photos, suggesting the data used to train the model.
* **Modeler Diversity:** A group of diverse people, indicating the importance of diverse perspectives in model development.
* **Architecture & Objectives:** A network diagram, representing the structure and goals of the model.
* These three components feed into **Training Bias Sources**.
* **Middle (Model):**
* **Training Bias Sources:** This box represents the accumulation of biases from the training data, modelers, and architecture.
* **Intrinsic Bias:** This box represents the bias inherent in the Foundation Model.
* **Foundation Model:** A blue and purple geometric sphere, representing the core model.
* **Right Side (Output):**
* **Adaptation Bias Sources Per-Model:** This box lists the sources of bias that can arise during the adaptation of the model, including data, mechanism, and modelers.
* **User Experience:** A group of people, representing the users who interact with the model.
* **Extrinsic Harm:** This box lists the potential harms that can result from bias in the model, including representational bias, performance disparities, abuse, and stereotypes.
* **Flow:**
* Arrows indicate the flow of bias from the left (training) to the right (user experience).
* Training data, modeler diversity, and architecture & objectives contribute to training bias sources.
* Training bias sources lead to intrinsic bias in the foundation model.
* Adaptation bias sources per-model, along with the foundation model, influence the user experience.
* The user experience can result in extrinsic harm.
### Key Observations
* The diagram highlights the multiple stages at which bias can be introduced into a machine learning model.
* It emphasizes the importance of considering both intrinsic and extrinsic sources of bias.
* The diagram suggests that bias can have a significant impact on user experience, leading to potential harm.
### Interpretation
The diagram illustrates a critical issue in machine learning: the presence and propagation of bias. It demonstrates that bias is not simply a result of flawed data but can arise from various stages of the model development process, including the choice of training data, the diversity (or lack thereof) of the modelers, the model's architecture, and the adaptation process.
The diagram's flow emphasizes that bias can accumulate and amplify as it moves through the system, ultimately affecting the user experience and potentially causing harm. The inclusion of "Modeler Diversity" as a source of bias highlights the importance of diverse perspectives in mitigating bias. The "Adaptation Bias Sources Per-Model" box suggests that bias can also be introduced during the customization or fine-tuning of a model for specific applications.
The diagram serves as a reminder that addressing bias in machine learning requires a holistic approach that considers all stages of the model development process and the potential impact on users.