\n
## Line Charts: Training Metrics
### Overview
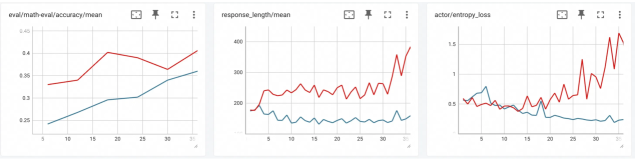
The image presents three separate line charts, likely representing training metrics for a machine learning model. Each chart displays two lines over a range of training steps (x-axis). The charts are arranged horizontally. The metrics are: `eval/math_eval/accuracy/mean`, `response_length/mean`, and `actor_entropy/loss`. Each chart has a set of icons in the top-right corner: a save icon, a refresh icon, and a settings icon.
### Components/Axes
Each chart shares the following components:
* **X-axis:** Represents training steps, ranging from approximately 0 to 30. The axis is labeled with numerical values at intervals of 5.
* **Y-axis:** Represents the metric value. The scale varies for each chart.
* **Line 1 (Red):** Represents the training metric.
* **Line 2 (Blue):** Represents the validation metric.
* **Titles:** Each chart has a title indicating the metric being plotted.
Specifics for each chart:
* **Chart 1:** `eval/math_eval/accuracy/mean`. Y-axis ranges from approximately 0.2 to 0.45.
* **Chart 2:** `response_length/mean`. Y-axis ranges from approximately 150 to 400.
* **Chart 3:** `actor_entropy/loss`. Y-axis ranges from approximately 0 to 1.6.
### Detailed Analysis or Content Details
**Chart 1: `eval/math_eval/accuracy/mean`**
* **Red Line (Training Accuracy):** Starts at approximately 0.35 at step 0, increases to a peak of approximately 0.43 at step 15, then decreases slightly to approximately 0.41 at step 30. The line exhibits an overall upward trend with some fluctuation.
* **Blue Line (Validation Accuracy):** Starts at approximately 0.25 at step 0, increases steadily to approximately 0.35 at step 30. The line exhibits a consistent upward trend.
**Chart 2: `response_length/mean`**
* **Red Line (Training Response Length):** Starts at approximately 250 at step 0, fluctuates between approximately 200 and 350, and then increases sharply to approximately 400 at step 30. The line shows significant volatility.
* **Blue Line (Validation Response Length):** Starts at approximately 175 at step 0, fluctuates between approximately 150 and 225, and remains relatively stable around 200 at step 30. The line shows less volatility than the red line.
**Chart 3: `actor_entropy/loss`**
* **Red Line (Training Loss):** Starts at approximately 0.6 at step 0, decreases to approximately 0.3 at step 10, then increases dramatically to approximately 1.6 at step 30. The line exhibits a strong upward trend in the later stages.
* **Blue Line (Validation Loss):** Starts at approximately 0.5 at step 0, decreases to approximately 0.2 at step 10, and then increases slowly to approximately 0.3 at step 30. The line shows a relatively stable trend.
### Key Observations
* In Chart 1, the validation accuracy consistently lags behind the training accuracy, indicating potential overfitting.
* In Chart 2, the training response length shows a significant increase towards the end of training, while the validation response length remains relatively stable.
* In Chart 3, the training loss increases sharply towards the end of training, while the validation loss remains relatively stable, suggesting overfitting and potential instability.
* The red lines (training metrics) generally exhibit more volatility than the blue lines (validation metrics).
### Interpretation
The charts likely represent the performance of a machine learning model during training. The increasing gap between training and validation metrics in all three charts suggests that the model is overfitting to the training data. The sharp increase in training loss and response length, coupled with the relatively stable validation metrics, indicates that the model may be diverging or becoming unstable towards the end of training.
The `eval/math_eval/accuracy/mean` chart shows that the model is learning to perform math evaluations, but the gap between training and validation accuracy suggests that it may not generalize well to unseen data. The `response_length/mean` chart indicates that the model is generating longer responses during training, which could be a sign of increased complexity or verbosity. The `actor_entropy/loss` chart suggests that the model is becoming more uncertain or unpredictable, which could be a result of overfitting or instability.
Further investigation is needed to determine the cause of the overfitting and instability. Potential solutions include regularization, early stopping, or adjusting the learning rate.