## Line Charts: Model Performance Metrics
### Overview
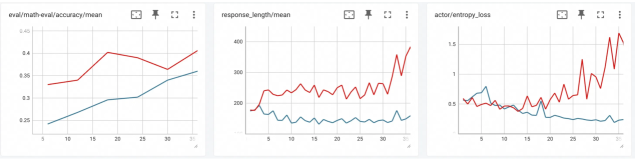
The image contains three line charts comparing performance metrics of two models (Model A in red, Model B in blue) across different evaluation dimensions. Each chart tracks a distinct metric over a shared x-axis range (5–35), with distinct y-axis scales.
---
### Components/Axes
1. **Chart 1: `eval/math-eval/accuracy/mean`**
- **X-axis**: Iteration/Step (5–35)
- **Y-axis**: Accuracy (0.25–0.45)
- **Legend**:
- Red: Model A
- Blue: Model B
2. **Chart 2: `response_length/mean`**
- **X-axis**: Iteration/Step (5–35)
- **Y-axis**: Response Length (200–400)
- **Legend**:
- Red: Model A
- Blue: Model B
3. **Chart 3: `actor/entropy_loss`**
- **X-axis**: Iteration/Step (5–35)
- **Y-axis**: Entropy Loss (0.5–1.5)
- **Legend**:
- Red: Model A
- Blue: Model B
---
### Detailed Analysis
#### Chart 1: Accuracy
- **Model A (Red)**:
- Starts at ~0.33, peaks at ~0.4 (x=20), dips to ~0.35 (x=30), then rises to ~0.4 (x=35).
- Shows volatility with two local maxima.
- **Model B (Blue)**:
- Starts at ~0.25, steadily increases to ~0.36 (x=35).
- Smooth upward trend with no fluctuations.
#### Chart 2: Response Length
- **Model A (Red)**:
- Oscillates between ~200–300, peaking at ~350 (x=35).
- High variability with frequent local maxima.
- **Model B (Blue)**:
- Remains flat between ~150–200.
- Minimal deviation throughout.
#### Chart 3: Entropy Loss
- **Model A (Red)**:
- Begins at ~0.5, dips to ~0.4 (x=10), then surges to ~1.5 (x=35).
- Sharp exponential growth in later steps.
- **Model B (Blue)**:
- Starts at ~0.5, peaks at ~0.7 (x=5), then declines to ~0.5 (x=35).
- Initial spike followed by stabilization.
---
### Key Observations
1. **Accuracy vs. Entropy**: Model A achieves higher accuracy but exhibits increasing entropy loss, suggesting potential overfitting or instability.
2. **Response Length**: Model A’s responses grow longer and more variable over time, while Model B maintains consistency.
3. **Model B’s Stability**: Model B shows smoother trends across all metrics, indicating robustness but lower peak performance.
---
### Interpretation
- **Model A** prioritizes accuracy at the cost of computational efficiency (longer responses) and stability (rising entropy). Its erratic entropy loss may reflect complex decision-making or overfitting to training data.
- **Model B** balances simplicity and consistency, with stable entropy and response lengths but lower accuracy. This could make it preferable for applications requiring reliability over peak performance.
- The divergence in entropy trends (Model A’s spike vs. Model B’s decline) highlights a trade-off between model complexity and generalization. Further investigation into training data or regularization techniques might clarify these dynamics.