## Diagram: Layered Components
### Overview
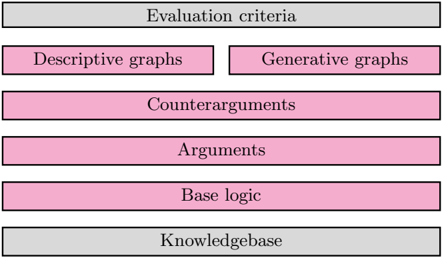
The image presents a layered diagram depicting components or elements arranged vertically. The components are represented as rectangular blocks, some colored light gray and others light pink. The diagram appears to illustrate a hierarchical structure or a sequence of steps.
### Components/Axes
The diagram consists of the following components, listed from top to bottom:
1. **Evaluation criteria** (light gray)
2. **Descriptive graphs** (light pink)
3. **Generative graphs** (light pink)
4. **Counterarguments** (light pink)
5. **Arguments** (light pink)
6. **Base logic** (light pink)
7. **Knowledgebase** (light gray)
### Detailed Analysis or ### Content Details
The diagram shows a layered arrangement of components. The "Evaluation criteria" is at the top, followed by "Descriptive graphs" and "Generative graphs" side-by-side. Below these are "Counterarguments", "Arguments", and "Base logic" stacked vertically. The "Knowledgebase" is at the bottom.
### Key Observations
* The diagram uses two colors: light gray and light pink.
* The components are arranged in a specific order, suggesting a flow or hierarchy.
* "Descriptive graphs" and "Generative graphs" are positioned next to each other, possibly indicating a related grouping.
### Interpretation
The diagram likely represents a system or process where "Evaluation criteria" and "Knowledgebase" form the outer layers, possibly acting as inputs and outputs or constraints. The light pink components ("Descriptive graphs", "Generative graphs", "Counterarguments", "Arguments", "Base logic") could represent the core processing steps or elements within the system. The arrangement suggests a flow from the "Knowledgebase" and "Evaluation criteria" through the intermediate components. The separation of "Descriptive graphs" and "Generative graphs" might indicate different types of graph-based processing or analysis.