\n
## Diagram: System Architecture/Component Stack
### Overview
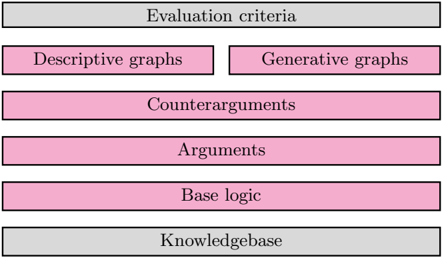
The image depicts a layered diagram representing a system architecture or component stack. The layers are arranged vertically, suggesting a hierarchical structure. The layers alternate in color between light gray and light pink. The diagram appears to illustrate the components involved in a reasoning or argumentation process.
### Components/Axes
The diagram consists of the following components, listed from top to bottom:
1. **Evaluation criteria** (light gray)
2. **Descriptive graphs** (light pink)
3. **Generative graphs** (light pink)
4. **Counterarguments** (light pink)
5. **Arguments** (light pink)
6. **Base logic** (light pink)
7. **Knowledgebase** (light gray)
There are no axes or scales present in this diagram. It is a purely structural representation.
### Detailed Analysis or Content Details
The diagram is a stack of rectangular blocks, each representing a component. The blocks are aligned horizontally, and the text within each block is centered. The alternating colors (light gray and light pink) visually separate the layers. The components are arranged in a clear top-down order.
### Key Observations
The diagram highlights a layered approach to reasoning or argumentation. The "Knowledgebase" and "Evaluation criteria" are positioned at the top and bottom, respectively, suggesting they form the foundation and the final assessment stage. The intermediate layers ("Descriptive graphs", "Generative graphs", "Counterarguments", "Arguments", "Base logic") represent the processing steps involved in building and evaluating arguments.
### Interpretation
This diagram likely represents the architecture of a system designed for automated reasoning, argument generation, or debate. The "Knowledgebase" provides the foundational information. "Base logic" represents the rules and principles used for reasoning. "Descriptive graphs" and "Generative graphs" might refer to methods for representing and creating arguments, respectively. "Arguments" and "Counterarguments" represent the core of the debate process. Finally, "Evaluation criteria" define the standards used to assess the quality and validity of the arguments. The alternating colors could signify different types of processing or data sources. The diagram suggests a systematic and structured approach to reasoning, where each layer builds upon the previous one. It is a conceptual model rather than a detailed technical specification.