## Diagram: Evaluation Framework Structure
### Overview
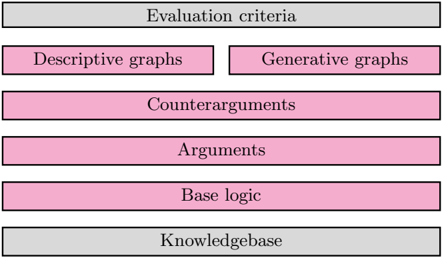
The image displays a vertical, hierarchical diagram composed of seven rectangular boxes arranged in a stacked layout. The diagram appears to represent a structured framework or process, likely for evaluating or constructing arguments, possibly in the context of AI, logic, or data analysis. The boxes are color-coded (gray and pink) and contain specific textual labels that define their function within the hierarchy.
### Components/Axes
The diagram is organized into a single column with the following components, listed from top to bottom:
1. **Top Box (Gray):** "Evaluation criteria"
2. **Second Row (Two Pink Boxes, Side-by-Side):**
* Left: "Descriptive graphs"
* Right: "Generative graphs"
3. **Third Box (Pink):** "Counterarguments"
4. **Fourth Box (Pink):** "Arguments"
5. **Fifth Box (Pink):** "Base logic"
6. **Bottom Box (Gray):** "Knowledgebase"
**Spatial Grounding:** The two gray boxes ("Evaluation criteria" and "Knowledgebase") act as the top and bottom anchors of the diagram. The five pink boxes are nested between them. The "Descriptive graphs" and "Generative graphs" boxes are the only pair placed horizontally adjacent to each other, directly beneath the top gray box. All other pink boxes are stacked vertically in a single column below them.
### Detailed Analysis
The diagram presents a clear top-down or bottom-up flow of information or dependency.
* **Top Layer (Gray):** "Evaluation criteria" sits at the apex, suggesting it is the overarching standard or goal.
* **Graph Layer (Pink):** Immediately below the criteria are two parallel components: "Descriptive graphs" and "Generative graphs." This indicates that two distinct types of graphical representations or models are central to the framework, possibly used for analysis (descriptive) and creation/simulation (generative).
* **Argumentation Layer (Pink):** Below the graphs is a sequence of three boxes: "Counterarguments," "Arguments," and "Base logic." This sequence suggests a logical progression where foundational reasoning ("Base logic") supports the formulation of "Arguments," which are then tested against or refined by "Counterarguments." The placement of "Counterarguments" above "Arguments" is notable; it may imply that challenging existing arguments is a step that precedes or refines the final argumentative structure.
* **Foundation Layer (Gray):** The entire structure rests upon the "Knowledgebase," indicating that all logic, arguments, and graphical analysis are grounded in a body of established knowledge or data.
### Key Observations
1. **Color Coding:** The use of gray for the top ("Evaluation criteria") and bottom ("Knowledgebase") boxes visually frames the core process (in pink) between an objective and a foundation.
2. **Parallel vs. Sequential Elements:** The only parallel processing or components in the diagram are the two graph types. All other elements are strictly sequential.
3. **Logical Flow Direction:** The diagram does not use arrows, so the flow is implied by the vertical stacking. The most intuitive reading is a **bottom-up flow**: starting from the "Knowledgebase," one develops "Base logic," constructs "Arguments," considers "Counterarguments," and then uses both "Descriptive" and "Generative graphs" to analyze the situation, all evaluated against the "Evaluation criteria." A top-down reading (criteria dictating graph use, which shapes arguments grounded in logic and knowledge) is also plausible.
### Interpretation
This diagram outlines a comprehensive framework for rigorous, knowledge-grounded reasoning and evaluation. It integrates quantitative/visual analysis (graphs) with qualitative/logical reasoning (arguments, logic).
* **What it suggests:** The framework emphasizes that robust evaluation ("Evaluation criteria") is not based on a single method. It requires both analytical tools (Descriptive graphs to understand "what is") and creative/synthetic tools (Generative graphs to explore "what could be"). These tools are applied to a structured argumentative process that is explicitly challenged ("Counterarguments") and rooted in formal reasoning ("Base logic") and a shared foundation of facts ("Knowledgebase").
* **Relationships:** The "Knowledgebase" is the substrate. "Base logic" extracts or formalizes rules from it. "Arguments" are built using that logic. "Counterarguments" stress-test those arguments. The resulting refined position is then analyzed visually and quantitatively through the two graph types. The entire process is measured against the "Evaluation criteria."
* **Notable Anomaly/Insight:** The placement of "Counterarguments" *above* "Arguments" is a subtle but powerful design choice. It visually prioritizes the act of challenging a position as a critical step that occurs *before* finalizing the argumentative structure for graphical analysis. This promotes a culture of critical thinking and pre-emptive validation rather than post-hoc justification. The framework appears designed to minimize bias and ensure conclusions are both logically sound and empirically testable.