## Flowchart: Evaluation Framework Structure
### Overview
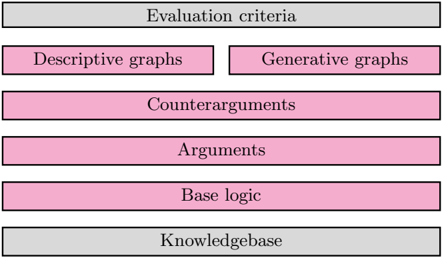
The image depicts a hierarchical flowchart outlining an evaluation framework. It consists of six labeled sections arranged vertically, with two gray sections at the top and bottom acting as headers/footers, and four pink rectangles representing core components in between.
### Components/Axes
1. **Top Header (Gray)**: "Evaluation criteria" (centered)
2. **First Row (Pink)**:
- Left: "Descriptive graphs"
- Right: "Generative graphs"
3. **Second Row (Pink)**: "Counterarguments" (full width)
4. **Third Row (Pink)**: "Arguments" (full width)
5. **Fourth Row (Pink)**: "Base logic" (full width)
6. **Bottom Footer (Gray)**: "Knowledgebase" (centered)
### Detailed Analysis
- **Spatial Structure**:
- The flowchart uses a top-down vertical layout with equal-width sections.
- Gray sections ("Evaluation criteria" and "Knowledgebase") serve as bookends.
- Pink rectangles represent intermediate components, with the first row split into two parallel elements ("Descriptive graphs" and "Generative graphs").
- **Textual Content**:
- All labels are in English, using title case.
- No numerical values, scales, or legends present.
- No embedded diagrams or data tables.
### Key Observations
1. The framework begins with "Evaluation criteria" as the overarching goal.
2. The split between "Descriptive graphs" and "Generative graphs" suggests a bifurcation in methodology or data representation approaches.
3. "Counterarguments" and "Arguments" occupy equal visual weight, emphasizing balanced dialectical analysis.
4. "Base logic" precedes "Knowledgebase," implying foundational reasoning precedes data integration.
### Interpretation
This flowchart represents a structured evaluation process where:
1. **Methodological Choice**: The initial split between descriptive (static data visualization) and generative (dynamic model-based) graphs indicates a decision point in analytical approach.
2. **Dialectical Process**: The pairing of "Counterarguments" and "Arguments" suggests a rigorous debate structure before reaching conclusions.
3. **Knowledge Integration**: The bottom placement of "Knowledgebase" positions it as the foundational input rather than the output, contrasting with typical top-down knowledge application models.
4. **Logical Flow**: The progression from criteria → methodology → debate → logic → knowledgebase implies a bottom-up construction of evaluation rather than top-down imposition.
The absence of numerical data or directional arrows leaves the exact relationships between components open to interpretation, but the vertical stacking strongly suggests a sequential process. The equal width of all pink sections implies equal importance in the evaluation hierarchy.