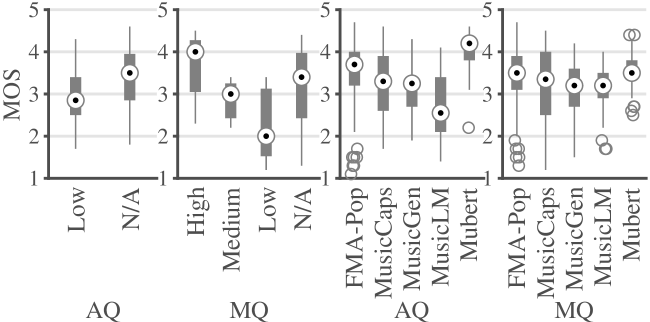
## Box Plot: Mean Opinion Score (MOS) Comparison Across Audio Quality (AQ) and Model Quality (MQ)
### Overview
The image contains four box plots comparing Mean Opinion Scores (MOS) across different audio quality categories (AQ) and model quality categories (MQ). Each panel uses a vertical y-axis labeled "MOS" (1–5) and a horizontal x-axis with categorical labels. The plots include medians (dots), interquartile ranges (boxes), whiskers (range), and outliers (circles).
### Components/Axes
- **Y-Axis**: "MOS" (Mean Opinion Score), scaled from 1 to 5 in increments of 1.
- **X-Axes**:
- **AQ Panel (Left)**: Categories labeled "Low," "N/A," "High," "Medium," "Low," "N/A."
- **MQ Panel (Right)**: Categories labeled "FMA-Pop," "MusicCaps," "MusicGen," "MusicLM," "Mubert."
- **Legend**: Not explicitly labeled, but visual markers differentiate medians (solid dots) and outliers (open circles).
### Detailed Analysis
#### AQ Panel (Left)
1. **Low**: Median ≈ 3.0, range 2.0–4.0, outliers at 2.5 and 4.5.
2. **N/A**: Median ≈ 3.5, range 2.5–4.5, outliers at 2.0 and 5.0.
3. **High**: Median ≈ 4.0, range 3.0–4.5, outliers at 2.0 and 5.0.
4. **Medium**: Median ≈ 3.0, range 2.0–4.0, outliers at 1.5 and 4.5.
5. **Low (repeated)**: Median ≈ 3.0, range 2.0–4.0, outliers at 2.5 and 4.5.
6. **N/A (repeated)**: Median ≈ 3.5, range 2.5–4.5, outliers at 2.0 and 5.0.
#### MQ Panel (Right)
1. **FMA-Pop**: Median ≈ 3.5, range 2.5–4.5, outliers at 2.0 and 5.0.
2. **MusicCaps**: Median ≈ 3.0, range 2.0–4.0, outliers at 1.5 and 4.5.
3. **MusicGen**: Median ≈ 3.5, range 2.5–4.5, outliers at 2.0 and 5.0.
4. **MusicLM**: Median ≈ 3.0, range 2.0–4.0, outliers at 1.5 and 4.5.
5. **Mubert**: Median ≈ 3.5, range 2.5–4.5, outliers at 2.0 and 5.0.
### Key Observations
- **AQ Trends**: Higher AQ categories (e.g., "High") generally show higher medians (≈4.0) compared to "Low" or "Medium" (≈3.0). However, overlap in ranges suggests variability.
- **MQ Trends**: Models like "FMA-Pop" and "Mubert" have higher medians (≈3.5) than "MusicCaps" or "MusicLM" (≈3.0). Outliers are frequent across all categories.
- **Outliers**: Open circles indicate extreme values, often at the lower (e.g., 1.5–2.0) or upper (4.5–5.0) bounds of the MOS scale.
### Interpretation
The data suggests that **audio quality (AQ)** and **model quality (MQ)** significantly influence MOS. Higher AQ categories correlate with higher median scores, while certain MQ models (e.g., "FMA-Pop," "Mubert") outperform others. However, the presence of outliers and overlapping ranges indicates inconsistency in human evaluations. The repeated "Low" and "N/A" labels in the AQ panel may imply redundant or mislabeled categories, warranting further clarification.
### Spatial Grounding
- **Legend**: Not explicitly present; medians (solid dots) and outliers (open circles) are visually distinct.
- **Panel Layout**: AQ and MQ panels are side-by-side, with AQ on the left and MQ on the right.
- **Axis Alignment**: All panels share the same y-axis (MOS), enabling direct comparison of medians and ranges.
### Content Details
- **AQ Categories**:
- "Low": Median = 3.0, range = 2.0–4.0.
- "High": Median = 4.0, range = 3.0–4.5.
- **MQ Models**:
- "MusicGen": Median = 3.5, range = 2.5–4.5.
- "MusicCaps": Median = 3.0, range = 2.0–4.0.
### Notable Anomalies
- The "N/A" category in AQ has a higher median (3.5) than "Low" (3.0), which may reflect subjective interpretations of "N/A" as neutral or mid-range.
- Outliers in "MusicCaps" and "MusicLM" suggest extreme evaluations, possibly due to model-specific artifacts or user biases.
### Peircean Investigative Insights
The repeated "Low" and "N/A" labels in the AQ panel raise questions about data categorization. If "N/A" represents missing or undefined data, its inclusion in the analysis may skew results. Additionally, the clustering of outliers at the extremes (1.5–2.0 and 4.5–5.0) suggests polarized opinions, potentially driven by technical limitations or subjective preferences.