## Chart: Gemini-2.0-Flash Proportion of Flips vs. Iterations
### Overview
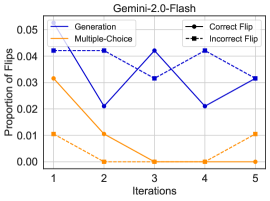
The image is a line chart titled "Gemini-2.0-Flash" showing the proportion of flips across iterations for different categories: Generation, Multiple-Choice, Correct Flip, and Incorrect Flip. The x-axis represents iterations (1 to 5), and the y-axis represents the proportion of flips (0.00 to 0.05).
### Components/Axes
* **Title:** Gemini-2.0-Flash
* **X-axis:** Iterations (1, 2, 3, 4, 5)
* **Y-axis:** Proportion of Flips (0.00, 0.01, 0.02, 0.03, 0.04, 0.05)
* **Legend:** Located in the top-left and top-right corners.
* Generation (solid blue line)
* Multiple-Choice (solid orange line)
* Correct Flip (solid black line with square markers)
* Incorrect Flip (dashed black line with square markers)
### Detailed Analysis
* **Generation (Solid Blue Line):** The proportion of flips starts at approximately 0.042 at iteration 1, decreases to approximately 0.021 at iteration 2, increases to approximately 0.042 at iteration 3, decreases to approximately 0.023 at iteration 4, and increases to approximately 0.032 at iteration 5.
* **Multiple-Choice (Solid Orange Line):** The proportion of flips starts at approximately 0.032 at iteration 1, decreases to approximately 0.010 at iteration 2, reaches 0.00 at iteration 3, remains at 0.00 at iteration 4, and increases to approximately 0.010 at iteration 5.
* **Correct Flip (Solid Black Line with Square Markers):** The proportion of flips starts at approximately 0.042 at iteration 1, decreases to approximately 0.031 at iteration 2, increases to approximately 0.042 at iteration 3, decreases to approximately 0.038 at iteration 4, and decreases to approximately 0.031 at iteration 5.
* **Incorrect Flip (Dashed Black Line with Square Markers):** The proportion of flips starts at approximately 0.010 at iteration 1, decreases to approximately 0.00 at iteration 2, remains at 0.00 at iteration 3, remains at 0.00 at iteration 4, and increases to approximately 0.010 at iteration 5.
### Key Observations
* The "Generation" and "Correct Flip" lines show similar trends, fluctuating between approximately 0.02 and 0.04.
* The "Multiple-Choice" line decreases sharply from iteration 1 to 3, remains at 0.00 until iteration 4, and then slightly increases at iteration 5.
* The "Incorrect Flip" line starts low, drops to 0, and then increases slightly at the end.
### Interpretation
The chart compares the proportion of flips across iterations for different methods or categories within the Gemini-2.0-Flash model. The "Generation" and "Correct Flip" categories exhibit similar patterns, suggesting a correlation between them. The "Multiple-Choice" category shows a significant decrease in the proportion of flips over the iterations, indicating a potential improvement or stabilization in performance. The "Incorrect Flip" category remains low, suggesting a relatively small proportion of incorrect flips across all iterations. The data suggests that the model's performance varies across different categories and iterations, with some categories showing more stability or improvement than others.