## Line Chart: Gemini-2.0-Flash Performance
### Overview
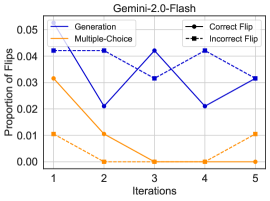
This image presents a line chart illustrating the "Proportion of Flips" across five "Iterations" for different model evaluation methods: "Generation", "Multiple-Choice", "Correct Flip", and "Incorrect Flip". The chart appears to track how these proportions change as the model undergoes iterative refinement.
### Components/Axes
* **Title:** Gemini-2.0-Flash (positioned at the top-center)
* **X-axis:** "Iterations" (labeled, ranging from 1 to 5, with evenly spaced markers)
* **Y-axis:** "Proportion of Flips" (labeled, ranging from 0.00 to 0.05, with evenly spaced markers)
* **Legend:** Located at the top-right corner, containing the following entries:
* "Generation" - Solid Blue Line
* "Multiple-Choice" - Dashed Orange Line
* "Correct Flip" - Solid Black Line with Circle Markers
* "Incorrect Flip" - Dashed Black Line with Square Markers
### Detailed Analysis
Let's analyze each data series individually:
* **Generation (Solid Blue Line):** This line exhibits a fluctuating trend. It starts at approximately 0.037 at Iteration 1, dips to a minimum of around 0.022 at Iteration 2, rises to a peak of approximately 0.042 at Iteration 3, decreases to around 0.032 at Iteration 4, and ends at approximately 0.031 at Iteration 5.
* **Multiple-Choice (Dashed Orange Line):** This line shows a decreasing trend. It begins at approximately 0.032 at Iteration 1, drops to around 0.01 at Iteration 2, continues to decrease to nearly 0.00 at Iteration 3, rises slightly to approximately 0.004 at Iteration 4, and ends at approximately 0.01 at Iteration 5.
* **Correct Flip (Solid Black Line with Circle Markers):** This line also fluctuates. It starts at approximately 0.042 at Iteration 1, remains relatively stable at around 0.04 at Iteration 2, rises to approximately 0.044 at Iteration 3, drops to a minimum of approximately 0.02 at Iteration 4, and ends at approximately 0.03 at Iteration 5.
* **Incorrect Flip (Dashed Black Line with Square Markers):** This line shows a fluctuating trend. It begins at approximately 0.04 at Iteration 1, remains relatively stable at around 0.04 at Iteration 2, rises to approximately 0.044 at Iteration 3, drops to approximately 0.03 at Iteration 4, and ends at approximately 0.03 at Iteration 5.
### Key Observations
* The "Multiple-Choice" proportion of flips consistently decreases over the five iterations, suggesting improvement in this evaluation method.
* The "Generation", "Correct Flip", and "Incorrect Flip" lines exhibit more volatile behavior, indicating less consistent performance or more sensitivity to iterative changes.
* The "Correct Flip" and "Incorrect Flip" lines are very close in value throughout the iterations.
* The "Generation" line starts and ends at similar values, with fluctuations in between.
### Interpretation
The chart suggests that the Gemini-2.0-Flash model shows improvement in "Multiple-Choice" evaluation as iterations progress, as indicated by the decreasing proportion of flips. The fluctuating behavior of the other metrics ("Generation", "Correct Flip", and "Incorrect Flip") could indicate that these evaluation methods are more sensitive to the specific changes made during each iteration, or that the model's performance in these areas is less stable. The proximity of the "Correct Flip" and "Incorrect Flip" lines suggests a relatively balanced rate of correct and incorrect flips, potentially indicating a need for further refinement in the model's decision-making process. The overall trend suggests that the model is learning and adapting, but further investigation is needed to understand the reasons behind the fluctuations in the "Generation", "Correct Flip", and "Incorrect Flip" metrics. The data suggests that the model is not simply memorizing answers, but is actively learning and adjusting its internal parameters.