## Line Chart: Gemini-2.0-Flip Proportions Over Iterations
### Overview
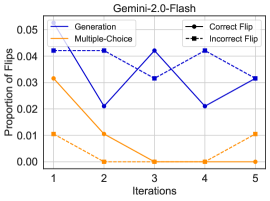
The image is a line chart titled "Gemini-2.0-Flash" that plots the "Proportion of Flips" against "Iterations" (from 1 to 5). It compares four different metrics or conditions, represented by distinct lines. The chart uses a white background with a light gray grid.
### Components/Axes
* **Title:** "Gemini-2.0-Flash" (centered at the top).
* **Y-Axis:**
* **Label:** "Proportion of Flips" (rotated vertically on the left).
* **Scale:** Linear, ranging from 0.00 to 0.05, with major tick marks at 0.00, 0.01, 0.02, 0.03, 0.04, and 0.05.
* **X-Axis:**
* **Label:** "Iterations" (centered at the bottom).
* **Scale:** Discrete, with integer values 1, 2, 3, 4, and 5.
* **Legend:** Located in the top-right corner of the chart area. It defines four data series:
1. **Generation:** Solid blue line.
2. **Multiple-Choice:** Solid orange line.
3. **Correct Flip:** Dashed black line with circular markers (●).
4. **Incorrect Flip:** Dashed black line with square markers (■).
### Detailed Analysis
The following data points are approximate, read from the chart's grid.
**1. Generation (Solid Blue Line):**
* **Trend:** Volatile, with a significant peak at iteration 3.
* **Data Points:**
* Iteration 1: ~0.040
* Iteration 2: ~0.020
* Iteration 3: ~0.040 (Peak)
* Iteration 4: ~0.020
* Iteration 5: ~0.030
**2. Multiple-Choice (Solid Orange Line):**
* **Trend:** Sharp decline from iteration 1 to 2, then plateaus near zero.
* **Data Points:**
* Iteration 1: ~0.030
* Iteration 2: ~0.010
* Iteration 3: ~0.000
* Iteration 4: ~0.000
* Iteration 5: ~0.000
**3. Correct Flip (Dashed Black Line, ● markers):**
* **Trend:** Declines to zero and remains flat.
* **Data Points:**
* Iteration 1: ~0.010
* Iteration 2: ~0.000
* Iteration 3: ~0.000
* Iteration 4: ~0.000
* Iteration 5: ~0.000
**4. Incorrect Flip (Dashed Black Line, ■ markers):**
* **Trend:** Starts at zero, shows a small rise and fluctuation in later iterations.
* **Data Points:**
* Iteration 1: ~0.000
* Iteration 2: ~0.005
* Iteration 3: ~0.000
* Iteration 4: ~0.010
* Iteration 5: ~0.005
### Key Observations
* **Highest Proportion:** The "Generation" metric consistently has the highest proportion of flips across all iterations, except at iteration 2 where it ties with "Multiple-Choice".
* **Diverging Paths:** "Multiple-Choice" and "Correct Flip" both trend downward to near-zero, while "Generation" and "Incorrect Flip" show sustained or increasing activity in later iterations.
* **Iteration 3 Anomaly:** Iteration 3 is a point of maximum divergence. "Generation" peaks, while "Multiple-Choice" and "Correct Flip" hit their minimum (zero).
* **Incorrect vs. Correct:** The proportion of "Incorrect Flip" surpasses "Correct Flip" from iteration 2 onward.
### Interpretation
This chart appears to analyze the behavior of a model named "Gemini-2.0-Flash" over a sequence of 5 iterations, focusing on "flips" – likely changes in model output or decisions.
* **Core Finding:** The "Generation" task exhibits the most volatile and highest rate of flipping, suggesting it is the most unstable or exploratory component of the model's process over these iterations.
* **Convergence vs. Divergence:** The "Multiple-Choice" and "Correct Flip" metrics converge to zero, indicating that for these specific conditions, the model's outputs stabilize and stop changing (flipping) after the first couple of iterations.
* **Error Emergence:** The rise in "Incorrect Flip" proportion, particularly its peak at iteration 4, is a critical observation. It suggests that as the process continues, the model may be making erroneous changes or that errors become more prominent in later stages, even as other metrics stabilize.
* **Overall Narrative:** The data paints a picture of a system where one major component ("Generation") remains highly active, while another ("Multiple-Choice") quickly settles. Crucially, the stability achieved in "Correct Flip" is not mirrored in "Incorrect Flip," hinting that the model's later-stage changes are more likely to be erroneous. This could indicate a need to investigate the model's behavior in later iterations to prevent error propagation.