## Line Graph: Gemini-2.0-Flash Performance Across Iterations
### Overview
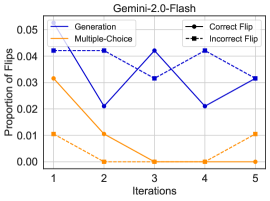
The chart illustrates the proportion of "Correct Flips" and "Incorrect Flips" across five iterations for two model configurations: "Generation" (blue line) and "Multiple-Choice" (orange line). The y-axis represents the proportion of flips (0.00–0.05), while the x-axis tracks iterations (1–5). The legend distinguishes between correct (solid black circles) and incorrect (dashed black squares) flips.
### Components/Axes
- **X-axis (Iterations)**: Labeled "Iterations" with discrete markers at 1, 2, 3, 4, 5.
- **Y-axis (Proportion of Flips)**: Labeled "Proportion of Flips" with a scale from 0.00 to 0.05 in increments of 0.01.
- **Legend**: Located in the top-right corner, with:
- **Correct Flip**: Solid black circles (blue line).
- **Incorrect Flip**: Dashed black squares (orange line).
- **Title**: "Gemini-2.0-Flash" centered at the top.
### Detailed Analysis
1. **Generation (Blue Line)**:
- **Iteration 1**: Proportion of flips ≈ 0.05 (highest point).
- **Iteration 2**: Drops sharply to ≈ 0.02.
- **Iteration 3**: Rises to ≈ 0.03.
- **Iteration 4**: Peaks again at ≈ 0.04.
- **Iteration 5**: Declines to ≈ 0.03.
- **Trend**: Volatile, with alternating increases and decreases.
2. **Multiple-Choice (Orange Line)**:
- **Iteration 1**: Starts at ≈ 0.03.
- **Iteration 2**: Drops to ≈ 0.01.
- **Iterations 3–4**: Remains near 0.00 (flatline).
- **Iteration 5**: Slight rise to ≈ 0.01.
- **Trend**: Sharp initial decline, followed by stability.
### Key Observations
- The "Generation" model exhibits significant fluctuation in flip proportions across iterations, suggesting instability or sensitivity to iterative adjustments.
- The "Multiple-Choice" model shows minimal variability after the second iteration, indicating robustness or consistency.
- The highest proportion of flips (≈0.05) occurs in the "Generation" model at iteration 1, while the lowest (≈0.00) is observed in "Multiple-Choice" during iterations 3–4.
### Interpretation
The data suggests that the "Generation" configuration is more dynamic, with flip proportions varying widely across iterations, potentially reflecting adaptive learning or error correction mechanisms. In contrast, the "Multiple-Choice" configuration stabilizes quickly, implying a less sensitive or more deterministic behavior. The sharp drop in "Multiple-Choice" after iteration 2 may indicate a convergence to an optimal state, whereas the "Generation" model’s oscillations could highlight ongoing optimization challenges. The legend’s marker distinction (solid vs. dashed) aligns with the visual data, confirming that "Correct Flip" and "Incorrect Flip" trends are accurately represented.