TECHNICAL ASSET FINGERPRINT
110401625191ec3b8af7f7cf
Click to view fullscreen
Press ESC or click to close
FOUND IN PAPERS
EXPERT: healer-alpha-free VERSION 1
RUNTIME: free/openrouter/healer-alpha
INTEL_VERIFIED
## Multi-Line Chart: Accuracy of Four AI Models Across Mathematical Topics
### Overview
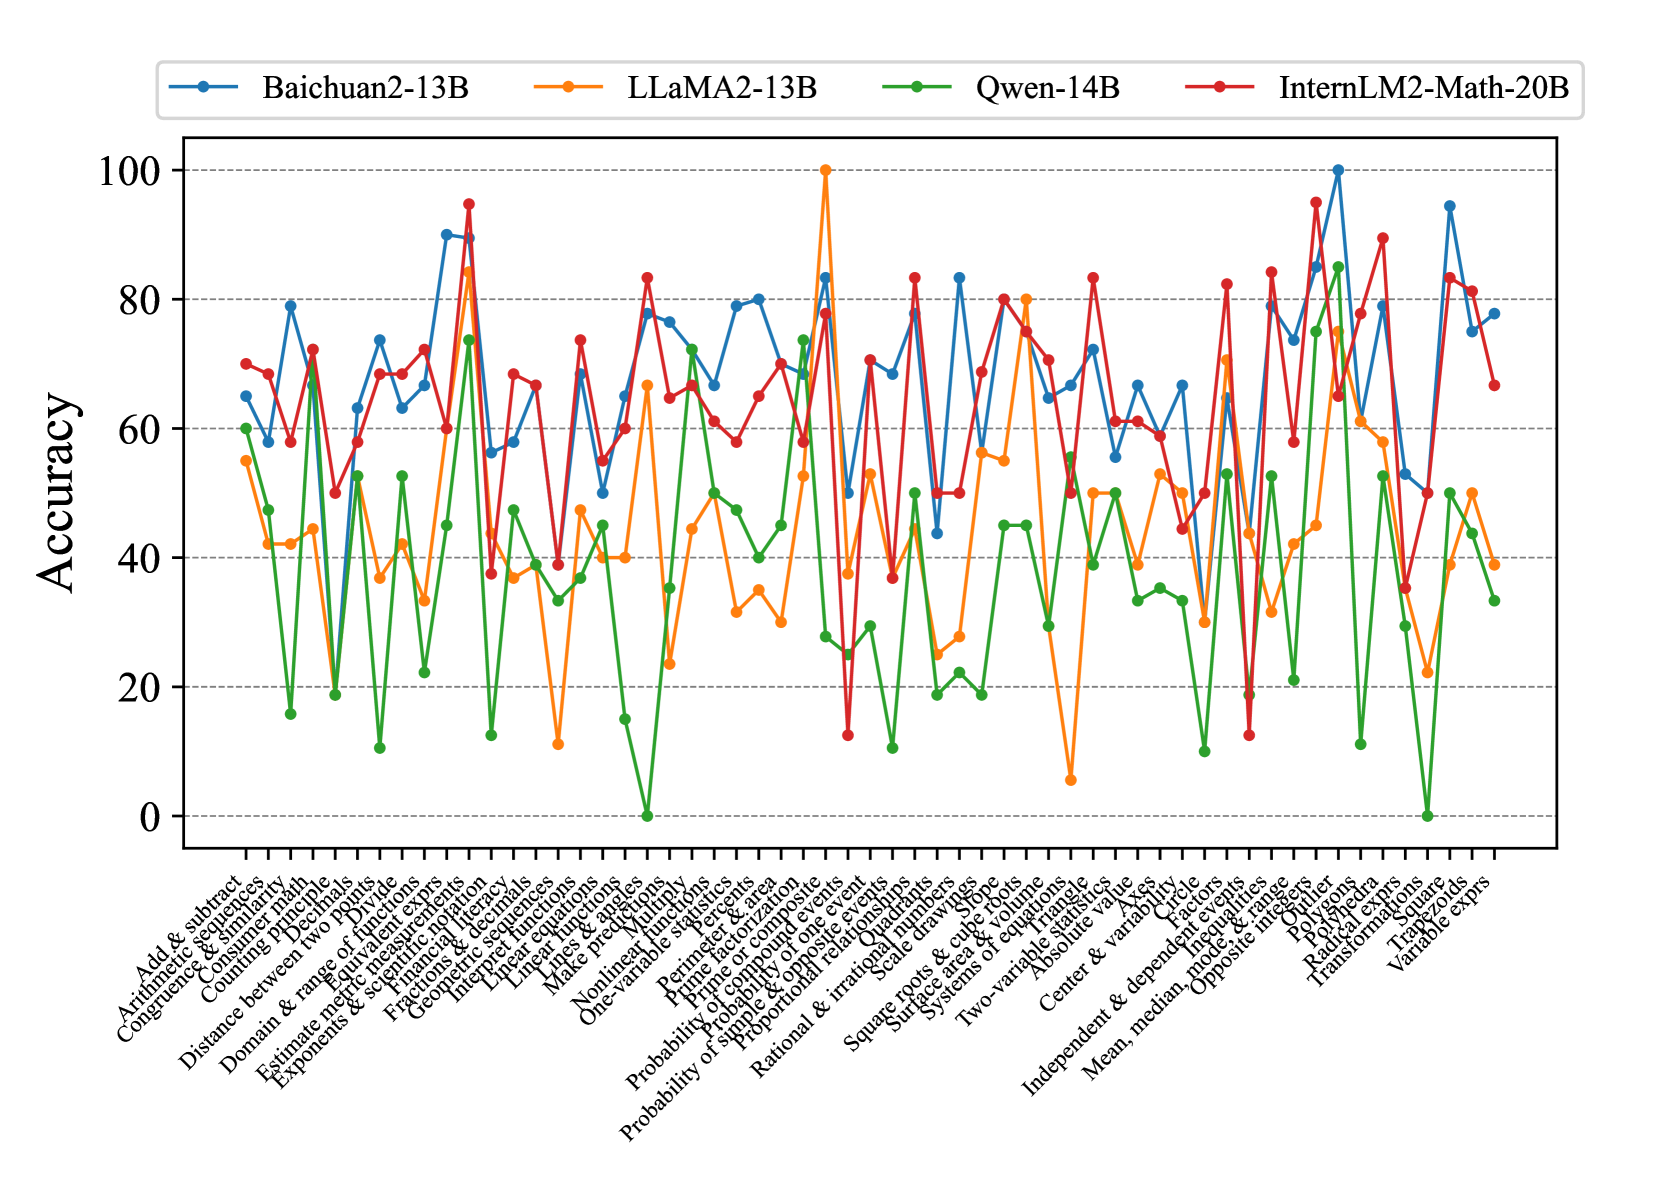
This image is a multi-line chart comparing the performance (accuracy) of four different large language models (LLMs) across a wide range of mathematical topics. The chart displays the accuracy percentage for each model on each topic, allowing for a direct comparison of their strengths and weaknesses in various mathematical domains.
### Components/Axes
* **Chart Type:** Multi-line chart with markers.
* **Y-Axis:** Labeled "Accuracy". The scale runs from 0 to 100 in increments of 20 (0, 20, 40, 60, 80, 100). Horizontal grid lines are present at these intervals.
* **X-Axis:** Lists 57 distinct mathematical topics or problem categories. The labels are rotated approximately 45 degrees for readability. The full list of topics, from left to right, is:
1. Add & subtract
2. Arithmetic sequences
3. Congruence & similarity
4. Counting methods
5. Counting Principle
6. Distance between two points
7. Divisibility
8. Domain & range of functions
9. Equivalent expressions
10. Estimate measurements
11. Exponents & scientific notation
12. Financial & depreciation
13. Fractions & decimals
14. Geometric sequences
15. Inequalities
16. Integral functions
17. Linear equations
18. Linear functions
19. Linear inequalities
20. Make predictions
21. Matrices
22. Nonlinear functions
23. One-variable statistics
24. Permutations
25. Prime factorization
26. Prime or composite
27. Probability of compound events
28. Probability of one event
29. Proportional relationships
30. Rational & irrational numbers
31. Scale drawings
32. Slope
33. Square roots & cube roots
34. Surface area & volume
35. Systems of equations
36. Two-variable relationships
37. Absolute value
38. Axis
39. Center & variation
40. Circle
41. Factors
42. Independent & dependent events
43. Inequalities
44. Inequalities & ranges
45. Mean, median, mode & range
46. Opposite integers
47. Outlier
48. Polygons
49. Polynomials
50. Radical expressions
51. Transformations
52. Trapezoids
53. Triangles
54. Variable exprs
* **Legend:** Positioned at the top center of the chart. It identifies four data series:
* **Baichuan2-13B:** Blue line with circular markers.
* **LLaMA2-13B:** Orange line with circular markers.
* **Qwen-14B:** Green line with circular markers.
* **InternLM2-Math-20B:** Red line with circular markers.
### Detailed Analysis
The chart shows high variability in model performance across topics. Below is an analysis of each model's trend and approximate key data points.
**1. Baichuan2-13B (Blue Line):**
* **Trend:** Shows a generally high but volatile performance. It frequently achieves the highest or second-highest accuracy on many topics but also has significant dips.
* **Key Points (Approximate):**
* Highs: ~90% on "Prime factorization", ~100% on "Outlier", ~95% on "Radical expressions".
* Lows: ~50% on "Linear equations", ~55% on "Systems of equations", ~50% on "Transformations".
* Notable: Peaks sharply at "Outlier" (100%) and "Radical expressions" (~95%).
**2. LLaMA2-13B (Orange Line):**
* **Trend:** Exhibits the most extreme volatility. It has the single highest point on the chart but also some of the lowest.
* **Key Points (Approximate):**
* Highs: **100% on "Prime factorization"** (the chart's maximum), ~85% on "Congruence & similarity", ~80% on "Systems of equations".
* Lows: **~5% on "Probability of compound events"** (the chart's minimum), ~10% on "Matrices", ~15% on "Nonlinear functions".
* Notable: The dramatic drop at "Probability of compound events" is a major outlier for this model.
**3. Qwen-14B (Green Line):**
* **Trend:** Generally the lowest-performing model across most topics, with a few exceptions where it matches or exceeds others. Its line is often at the bottom of the cluster.
* **Key Points (Approximate):**
* Highs: ~75% on "Congruence & similarity", ~85% on "Outlier", ~50% on "Transformations".
* Lows: **0% on "Matrices"**, ~0% on "Radical expressions", ~10% on "Distance between two points", ~10% on "Nonlinear functions".
* Notable: Hits the absolute bottom (0%) on two topics.
**4. InternLM2-Math-20B (Red Line):**
* **Trend:** Shows consistently strong performance, often occupying the top or second-highest position. It appears to be the most stable high-performer, with fewer extreme lows compared to LLaMA2-13B.
* **Key Points (Approximate):**
* Highs: ~95% on "Congruence & similarity", ~95% on "Outlier", ~90% on "Radical expressions".
* Lows: ~15% on "Probability of compound events", ~40% on "Linear equations", ~45% on "Systems of equations".
* Notable: While it also drops on "Probability of compound events", its low (~15%) is not as severe as LLaMA2-13B's (~5%).
### Key Observations
1. **Topic-Dependent Performance:** No single model is superior across all 54 topics. Performance is highly dependent on the specific mathematical domain.
2. **Extreme Outliers:** Two data points stand out: LLaMA2-13B's perfect score (100%) on "Prime factorization" and its near-zero score (~5%) on "Probability of compound events".
3. **Model Clustering:** On many topics (e.g., "Add & subtract", "Arithmetic sequences"), the models cluster within a 20-30% accuracy range. On others (e.g., "Prime factorization", "Probability of compound events"), the spread is enormous (50-95%).
4. **Consistent Laggard:** Qwen-14B (green) is frequently the lowest-performing model, hitting 0% accuracy on two topics.
5. **Strong Contenders:** Baichuan2-13B (blue) and InternLM2-Math-20B (red) are often the top two performers, trading the lead depending on the topic.
### Interpretation
This chart provides a granular benchmark of mathematical reasoning capabilities across different LLMs. The data suggests that:
* **Specialization vs. Generalization:** LLaMA2-13B demonstrates extreme specialization, achieving perfect accuracy in one area (Prime factorization) while failing almost completely in another (Probability of compound events). This indicates its training or architecture may be highly optimized for certain procedural math but lacks robustness in probabilistic reasoning.
* **Stability of Advanced Models:** InternLM2-Math-20B, despite being a math-specialized model, shows a more stable high-performance profile. Its smaller performance drops on difficult topics (like probability) suggest better generalization within mathematics compared to LLaMA2-13B.
* **The Challenge of Probability:** The topic "Probability of compound events" causes a severe performance drop for three of the four models (LLaMA2, Qwen, InternLM2). This highlights a specific, common weakness in LLM mathematical reasoning, likely due to the combinatorial and conditional nature of such problems.
* **Benchmarking Utility:** For a user or developer, this chart is invaluable for model selection. If one's primary need is solving problems related to "Outlier" detection or "Radical expressions," Baichuan2-13B or InternLM2-Math-20B would be strong choices. If the task involves "Matrices," Qwen-14B should be avoided. The chart moves beyond aggregate scores to reveal the nuanced landscape of AI capabilities in mathematics.
DECODING INTELLIGENCE...