## Line Graphs: Position vs. Timestep for Variables x and y
### Overview
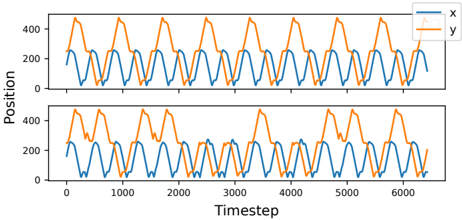
The image contains two vertically stacked line graphs, each plotting two variables (x and y) against timesteps. Both graphs share identical axes labels and scales, with timesteps ranging from 0 to 6000 and position values from 0 to 400. The top graph exhibits sharper oscillations, while the bottom graph shows smoother, more damped behavior.
### Components/Axes
- **X-axis**: Labeled "Timestep," with increments at 0, 1000, 2000, 3000, 4000, 5000, and 6000.
- **Y-axis**: Labeled "Position," with increments at 0, 200, and 400.
- **Legend**: Located in the top-right corner of both graphs, with:
- **Blue line**: Represents variable **x**.
- **Orange line**: Represents variable **y**.
- **Graph Structure**: Two identical axes configurations, with the top graph showing more pronounced peaks and the bottom graph displaying attenuated oscillations.
### Detailed Analysis
#### Top Graph
- **x (Blue)**: Peaks reach approximately **400** at timesteps ~500, 1500, 2500, 3500, 4500, and 5500. Troughs dip to ~100 at midpoints between peaks.
- **y (Orange)**: Peaks align with x but are slightly offset, reaching ~350 at timesteps ~1000, 2000, 3000, 4000, and 5000. Troughs remain near ~150.
#### Bottom Graph
- **x (Blue)**: Peaks reduced to ~250 at timesteps ~500, 1500, 2500, 3500, 4500, and 5500. Troughs stabilize near ~120.
- **y (Orange)**: Peaks align with x but are dampened, reaching ~200 at timesteps ~1000, 2000, 3000, 4000, and 5000. A notable dip occurs at ~5000 timesteps, dropping to ~100.
### Key Observations
1. **Top Graph**: Both variables exhibit synchronized oscillations with high amplitude (~400 for x, ~350 for y).
2. **Bottom Graph**: Oscillations are damped, with x and y peaking at ~250 and ~200, respectively. The y variable shows an anomalous dip at ~5000 timesteps.
3. **Phase Relationship**: In both graphs, y lags slightly behind x in peak timing, suggesting a potential causal or reactive relationship.
### Interpretation
The data suggests a time-dependent system where variable x drives oscillations, with y responding in a correlated but slightly delayed manner. The top graph may represent an initial, high-energy state, while the bottom graph reflects a stabilized or damped system. The anomalous dip in y at ~5000 timesteps in the bottom graph could indicate an external perturbation or system failure. These patterns are consistent with oscillatory systems in physics, engineering, or signal processing, where phase shifts and damping are common.