## Line Graph: Model Accuracy vs. Thinking Compute
### Overview
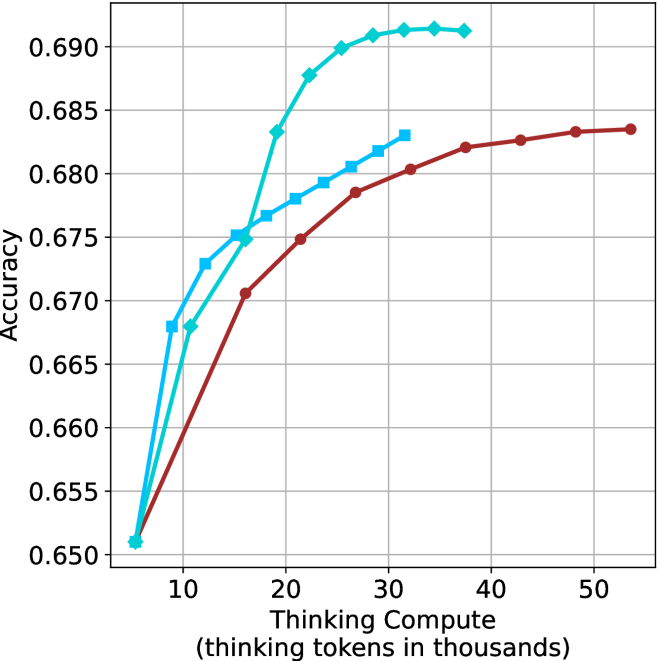
The image depicts a line graph comparing the accuracy of three computational models (Model A, Model B, Model C) across varying levels of "Thinking Compute" (measured in thousands of thinking tokens). The y-axis represents accuracy (0.650–0.690), while the x-axis ranges from 10,000 to 50,000 thinking tokens. All three models show increasing accuracy with higher compute, but with distinct performance trajectories.
### Components/Axes
- **X-axis**: "Thinking Compute (thinking tokens in thousands)" (10k–50k tokens, increments of 10k).
- **Y-axis**: "Accuracy" (0.650–0.690, increments of 0.005).
- **Legend**: Located in the top-right corner, with three entries:
- **Blue line**: Model A
- **Cyan line**: Model B
- **Red line**: Model C
### Detailed Analysis
1. **Model A (Blue)**:
- Starts at 0.650 accuracy at 10k tokens.
- Sharp upward trend, reaching 0.690 accuracy at 20k tokens.
- Plateaus at 0.690 from 20k to 50k tokens.
2. **Model B (Cyan)**:
- Begins at 0.655 accuracy at 10k tokens.
- Gradual increase, peaking at 0.690 accuracy at 30k tokens.
- Maintains 0.690 accuracy from 30k to 50k tokens.
3. **Model C (Red)**:
- Starts at 0.650 accuracy at 10k tokens.
- Steady upward trend, reaching 0.685 accuracy at 50k tokens.
- Minor dip to 0.675 at 20k tokens, then recovers.
### Key Observations
- **Model A** achieves peak accuracy (0.690) at the lowest compute (20k tokens) but plateaus early.
- **Model B** matches Model A’s peak accuracy (0.690) but requires 30k tokens, indicating higher compute efficiency.
- **Model C** shows the slowest improvement, reaching only 0.685 accuracy at 50k tokens.
- All models exhibit diminishing returns beyond 30k tokens, with accuracy gains becoming negligible.
### Interpretation
The data suggests that **higher thinking compute correlates with improved accuracy**, but the efficiency of this relationship varies by model:
- **Model A** is the most compute-efficient, achieving peak accuracy at 20k tokens.
- **Model B** balances compute and accuracy, requiring 30k tokens to match Model A’s peak.
- **Model C** demonstrates the least efficiency, needing 50k tokens for suboptimal accuracy (0.685).
Notably, the plateauing trends imply **diminishing returns** at higher compute levels. Model C’s slower improvement may indicate architectural limitations or suboptimal resource utilization. These findings highlight trade-offs between compute investment and accuracy gains, with Model A and B offering more efficient scaling than Model C.