## Line Chart with Range Bands: Reward vs Steps (Mean Min/Max)
### Overview
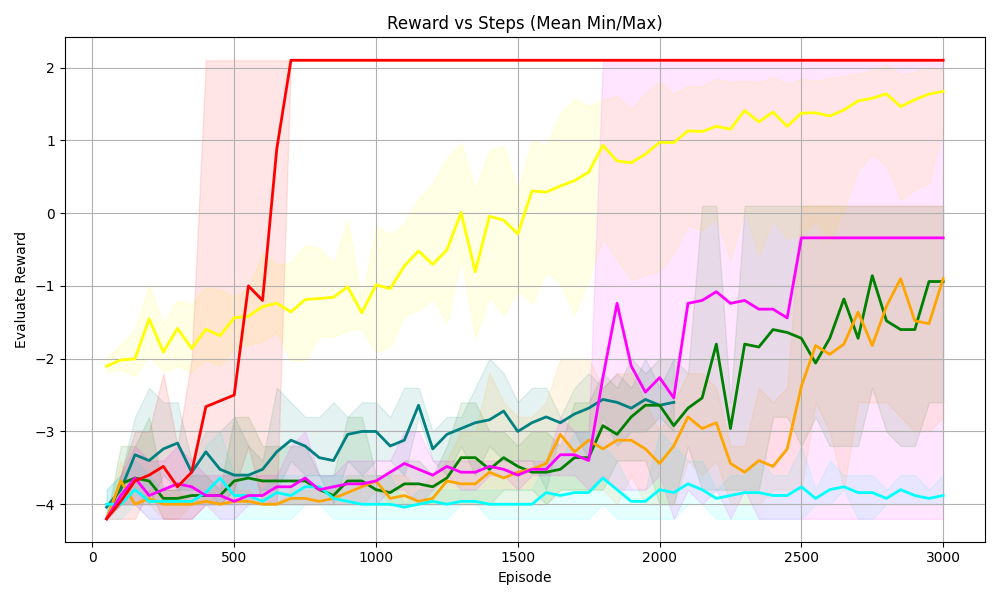
This is a line chart with shaded range bands (representing mean minimum and maximum values) tracking "Evaluate Reward" across training episodes (steps) for 7 distinct data series. The chart visualizes how reward performance evolves over 3000 episodes, with each series showing unique trends in reward value and variability.
### Components/Axes
- **Title**: *Reward vs Steps (Mean Min/Max)*, positioned at the top-center of the chart.
- **X-Axis**: Labeled *Episode*, positioned at the bottom-center. Scale ranges from 0 to 3000, with major tick marks at 0, 500, 1000, 1500, 2000, 2500, 3000.
- **Y-Axis**: Labeled *Evaluate Reward*, positioned at the left-center. Scale ranges from -4 to 2, with major tick marks at -4, -3, -2, -1, 0, 1, 2.
- **Data Series (Lines + Shaded Range Bands)**: 7 distinct colored lines, each paired with a matching shaded band (representing min/max reward range for that series):
1. Red line + light red shaded band
2. Yellow line + light yellow shaded band
3. Magenta (pink) line + light pink shaded band
4. Dark green line + light green shaded band
5. Orange line + light orange shaded band
6. Teal (dark cyan) line + light teal shaded band
7. Cyan (light blue) line + light cyan shaded band
### Detailed Analysis
1. **Red Series**:
- Trend: Starts at ~-4 (episode 0), rises sharply to ~-1 at episode 500, then jumps to a flat value of 2 at ~episode 700, remaining at 2 through episode 3000.
- Range Band: Wide band (spanning ~-4 to 2) from episode 0 to 700; after episode 700, the band collapses to a tight range around 2 (no variability).
2. **Yellow Series**:
- Trend: Starts at ~-2 (episode 0), fluctuates upward steadily, crossing 0 at ~episode 1500, 1 at ~episode 2000, and ending at ~1.5 at episode 3000.
- Range Band: Wide band (spanning ~-3 to 2) across all episodes, narrowing slightly at higher episode counts.
3. **Magenta Series**:
- Trend: Starts at ~-4 (episode 0), remains low until ~episode 1700, then rises sharply to ~-1 at episode 2000, jumps to ~-0.5 at episode 2500, and stays flat there through episode 3000.
- Range Band: Wide band (spanning ~-4 to 0) that shifts upward in parallel with the line's rise.
4. **Dark Green Series**:
- Trend: Starts at ~-4 (episode 0), fluctuates upward slowly, crossing -3 at ~episode 1000, -2 at ~episode 2000, and ending at ~-1 at episode 3000.
- Range Band: Band spanning ~-4 to -1, narrowing slightly at higher episodes.
5. **Orange Series**:
- Trend: Starts at ~-4 (episode 0), fluctuates upward with sharp spikes/dips, crossing -3 at ~episode 1500, -2 at ~episode 2500, and ending at ~-1 at episode 3000.
- Range Band: Band spanning ~-4 to -1, with wider fluctuations in the range compared to the dark green series.
6. **Teal Series**:
- Trend: Starts at ~-4 (episode 0), rises to ~-3 at episode 500, then fluctuates between -3 and -2.5 through episode 3000, ending at ~-2.5.
- Range Band: Band spanning ~-4 to -2, with the line staying centered in the band.
7. **Cyan Series**:
- Trend: Starts at ~-4 (episode 0), remains nearly flat between -4 and -3.8 across all 3000 episodes, with minimal fluctuations.
- Range Band: Tight band spanning ~-4 to -3.8, with almost no variability.
### Key Observations
- The red series is an outlier: it achieves the maximum reward (2) quickly and maintains it with no variability, while all other series have lower final rewards and ongoing variability.
- The yellow series is the only one to reach positive reward values (crossing 0 and 1) and shows the strongest upward trend among non-outlier series.
- The cyan series shows no meaningful improvement over 3000 episodes, remaining at the lowest reward range.
- All series except red and cyan show a general upward trend in reward over episodes, with varying rates of improvement and variability.
### Interpretation
This chart likely tracks reinforcement learning agent performance, where "Evaluate Reward" is a metric of task success, and "Episode" is training iterations.
- The red series represents an agent that quickly learned an optimal policy (max reward, no variability), possibly a baseline or a highly optimized agent.
- The yellow series represents an agent that steadily improved to achieve positive reward, indicating successful learning over time.
- The cyan series represents an agent that failed to learn, remaining at the lowest reward level with no improvement.
- The shaded bands show that most agents have significant variability in reward performance (wide bands), while the red agent's performance becomes consistent once it reaches maximum reward.
- The chart demonstrates that different agents (or training configurations) have drastically different learning trajectories, with some achieving optimal performance quickly, some improving steadily, and some failing to learn entirely.