## Diagram: Neural Network
### Overview
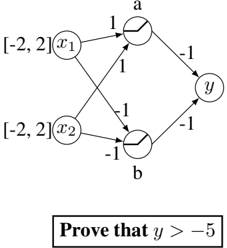
The image depicts a simple neural network diagram with two input nodes (x1, x2), two hidden nodes (a, b), and one output node (y). The diagram shows the connections between the nodes and the associated weights. The goal is to prove that the output y is greater than -5.
### Components/Axes
* **Input Nodes:**
* x1: Labeled "x1" with a range of [-2, 2]. Located on the top-left.
* x2: Labeled "x2" with a range of [-2, 2]. Located on the bottom-left.
* **Hidden Nodes:**
* a: Labeled "a". Located on the top-center. Contains a step function symbol.
* b: Labeled "b". Located on the bottom-center. Contains a step function symbol.
* **Output Node:**
* y: Labeled "y". Located on the right.
* **Connections/Weights:**
* x1 to a: Weight of 1.
* x1 to b: Weight of -1.
* x2 to a: Weight of 1.
* x2 to b: Weight of -1.
* a to y: Weight of -1.
* b to y: Weight of -1.
* **Text:** "Prove that y > -5" is displayed in a box at the bottom.
### Detailed Analysis
The neural network takes two inputs, x1 and x2, each ranging from -2 to 2. These inputs are fed into two hidden nodes, 'a' and 'b'. The connections between the input and hidden nodes have weights of either 1 or -1. The hidden nodes 'a' and 'b' each contain a step function. The outputs of 'a' and 'b' are then fed into the output node 'y' with weights of -1 each. The objective is to prove that the value of 'y' is greater than -5.
### Key Observations
* The input values x1 and x2 are bounded between -2 and 2.
* The weights between the input and hidden layers are either 1 or -1.
* The weights between the hidden and output layers are both -1.
* The hidden nodes contain step functions, which means their output will be either 0 or 1, depending on the input.
### Interpretation
The diagram represents a simple neural network designed to perform a specific computation. The goal of proving that y > -5 suggests that the network is intended to produce outputs within a certain range. The step functions in the hidden nodes introduce non-linearity, allowing the network to model more complex relationships between the inputs and the output. The specific weights and connections determine the function that the network implements. The problem statement "Prove that y > -5" implies that this inequality holds true for all possible input values within the specified range of [-2, 2] for x1 and x2.