# Technical Data Extraction: Performance Heatmap
## 1. Document Overview
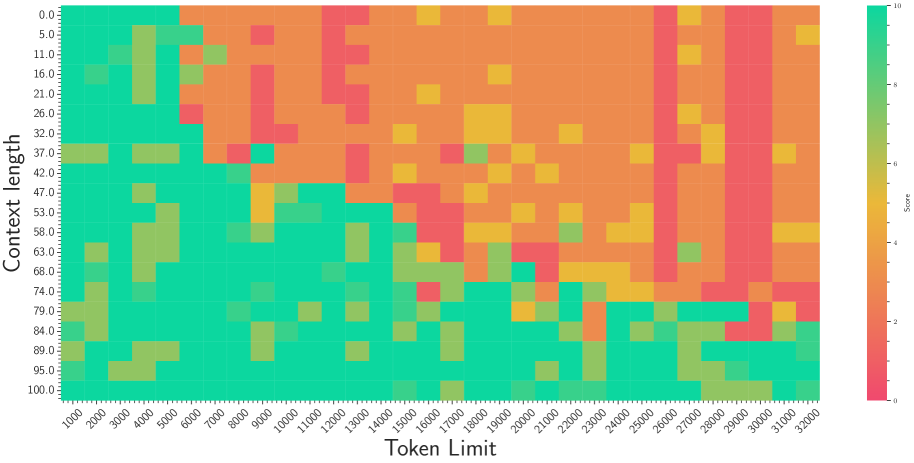
This image is a technical heatmap visualizing the relationship between two variables—**Token Limit** and **Context Length**—and their resulting effect on a **Score**. The chart likely represents the performance of a Large Language Model (LLM) or a similar data processing system across varying input constraints.
## 2. Component Isolation
### A. Header / Metadata
* **Language:** English.
* **Title:** None explicitly provided in the image.
### B. Main Chart (Heatmap)
* **Y-Axis (Vertical):** Labeled **"Context length"**.
* **Scale:** 0.0 to 100.0.
* **Markers:** 0.0, 5.0, 11.0, 16.0, 21.0, 26.0, 32.0, 37.0, 42.0, 47.0, 53.0, 58.0, 63.0, 68.0, 74.0, 79.0, 84.0, 89.0, 95.0, 100.0.
* **X-Axis (Horizontal):** Labeled **"Token Limit"**.
* **Scale:** 1,000 to 32,000.
* **Markers:** 1000, 2000, 3000, 4000, 5000, 6000, 7000, 8000, 9000, 10000, 11000, 12000, 13000, 14000, 15000, 16000, 17000, 18000, 19000, 20000, 21000, 22000, 23000, 24000, 25000, 26000, 27000, 28000, 29000, 30000, 31000, 32000.
### C. Legend (Color Bar)
* **Location:** Right side of the chart.
* **Label:** **"Score"**.
* **Scale:** 0 to 10.
* **Color Mapping:**
* **10 (Top):** Bright Green (High Performance).
* **5-7 (Middle):** Yellow/Orange (Moderate Performance).
* **0 (Bottom):** Red/Pink (Low Performance).
---
## 3. Trend Verification & Data Analysis
### Visual Trend Description
The heatmap shows a distinct diagonal degradation of performance.
* **High Performance Zone (Green):** Concentrated in the bottom-left quadrant (Low Token Limit, High Context Length) and the far left edge (Low Token Limit across all Context Lengths).
* **Low Performance Zone (Red/Orange):** Concentrated in the top-right quadrant (High Token Limit, Low Context Length).
* **Transition Zone:** There is a "noisy" diagonal boundary where the score fluctuates between green, yellow, and red as the Token Limit increases and Context Length decreases.
### Key Data Observations
1. **Stability at Low Token Limits:** For Token Limits between 1,000 and 5,000, the score remains predominantly green (Score ~8-10) regardless of the Context Length.
2. **Degradation Threshold:** A significant performance drop (transition to orange/red) begins to appear around the 6,000 Token Limit mark for Context Lengths above 32.0.
3. **Critical Failure Zones:**
* At a Token Limit of 32,000, the score is consistently low (orange/red) for Context Lengths between 0.0 and 74.0.
* Vertical "stripes" of red (Score 0-2) are visible at specific Token Limits, notably around 26,000 and 29,000, suggesting systemic failures at those specific intervals.
4. **Anomalies:** There are scattered green pixels within the high-token/low-context "red zone" (e.g., at Token Limit 18,000 / Context Length 37.0), indicating inconsistent performance or outliers.
---
## 4. Data Table Reconstruction (Representative Samples)
Due to the high density of the heatmap (approx. 20x32 grid), the following table represents the general score distribution:
| Context Length \ Token Limit | 1,000 | 8,000 | 16,000 | 24,000 | 32,000 |
| :--- | :--- | :--- | :--- | :--- | :--- |
| **0.0** | Green (10) | Orange (4) | Orange (4) | Orange (4) | Orange (4) |
| **26.0** | Green (10) | Red (2) | Orange (4) | Orange (4) | Orange (4) |
| **53.0** | Green (10) | Green (10) | Red (2) | Orange (4) | Orange (4) |
| **79.0** | Green/Yellow (8) | Green (10) | Green (10) | Orange (5) | Red (2) |
| **100.0** | Green (10) | Green (10) | Green (10) | Green (10) | Green (10) |
---
## 5. Summary of Findings
The system demonstrates an inverse relationship between Token Limit and Context Length performance. It is most reliable (Score 10) when the Context Length is high (near 100.0) or the Token Limit is very low (under 5,000). The most significant performance "dead zone" occurs when the Token Limit exceeds 20,000 and the Context Length is below 50.0.