# Technical Document Analysis of Heatmap Image
## Image Type
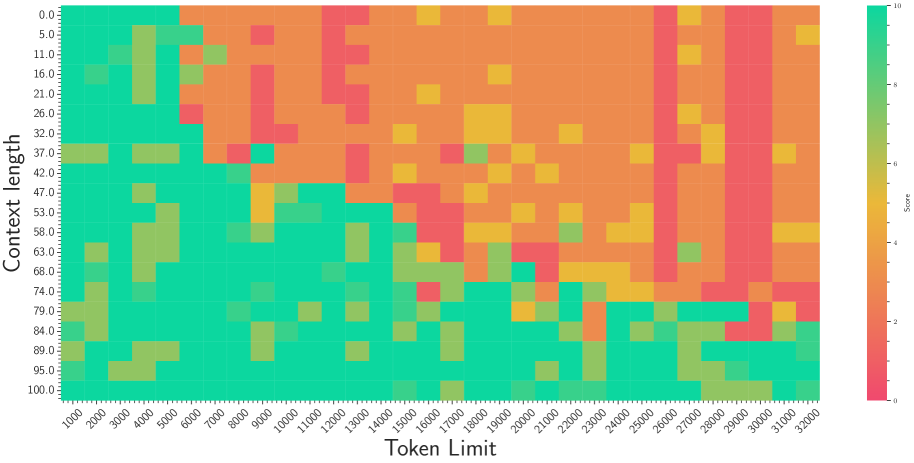
The image is a **heatmap** visualizing the relationship between two variables: **Token Limit** (x-axis) and **Context Length** (y-axis), with color intensity representing a numerical **Score** (0–10).
---
## Labels and Axis Titles
- **X-Axis (Horizontal):**
- Label: `Token Limit`
- Range: `1000` to `32000`
- Increment: `2000` (e.g., 1000, 3000, 5000, ..., 32000)
- **Y-Axis (Vertical):**
- Label: `Context Length`
- Range: `0` to `100`
- Increment: `5` (e.g., 0, 5, 10, ..., 100)
- **Legend:**
- Located on the **right side** of the heatmap.
- Gradient from **teal (0)** to **red (10)**.
- Label: `Score` (implicitly tied to color intensity).
---
## Color Scale and Legend
- **Color Bar:**
- Range: `0` (teal) to `10` (red).
- Intermediate values:
- `2` (light orange), `4` (orange), `6` (yellow), `8` (bright yellow).
- Spatial Grounding: Legend occupies the **rightmost 10% of the image width**, aligned vertically with the y-axis.
---
## Key Trends and Data Points
1. **General Pattern:**
- **Lower Token Limits (1000–8000):**
- Scores cluster in **teal (0–2)** and **green (3–5)**.
- Example: At `Token Limit = 1000`, scores are predominantly teal (0–2) across all `Context Length` values.
- **Mid-Range Token Limits (8000–20000):**
- Scores transition to **yellow (6–8)** and **orange (4–6)**.
- Example: At `Token Limit = 12000`, scores range from green (5) to yellow (8) depending on `Context Length`.
- **High Token Limits (20000–32000):**
- Scores peak in **red (9–10)**.
- Example: A **vertical red stripe** at `Token Limit = 28000` spans `Context Length = 5` to `15`, indicating maximum scores (10).
2. **Diagonal Transition:**
- A **diagonal band** of increasing scores (teal → red) runs from the **bottom-left (1000, 0)** to the **top-right (32000, 100)**, suggesting a **positive correlation** between `Token Limit` and `Score`.
3. **Anomalies:**
- **Red Vertical Stripe at 28000:**
- Scores reach `10` (red) for `Context Length = 5–15`.
- Surrounding areas show scores of `8–9` (yellow/orange).
- **Green Patches in Mid-Range:**
- At `Token Limit = 16000`, `Context Length = 30–40` shows scores of `6–7` (green/yellow).
---
## Categories and Sub-Categories
- **Token Limit Categories:**
- `1000–32000` (in 2000 increments).
- **Context Length Categories:**
- `0–100` (in 5 increments).
- **Score Categories:**
- `0–10` (mapped to teal → red).
---
## Spatial Grounding and Verification
- **Legend Position:** Right-aligned, occupying the full height of the heatmap.
- **Color Consistency Check:**
- Red squares (e.g., at `Token Limit = 28000`) align with the legend’s `10` (red).
- Teal squares (e.g., at `Token Limit = 1000`) align with the legend’s `0` (teal).
---
## Component Isolation
1. **Header:** No explicit header text.
2. **Main Chart:**
- Gridlines divide the heatmap into cells representing `(Token Limit, Context Length)` pairs.
- Color intensity encodes the `Score`.
3. **Footer:** No explicit footer text.
---
## Transcribed Text
- Axis Labels:
- `Token Limit` (x-axis)
- `Context Length` (y-axis)
- Legend:
- `Score` (color gradient: teal = 0, red = 10)
---
## Conclusion
The heatmap demonstrates that **higher Token Limits** (e.g., 28000) correlate with **higher Scores** (up to 10), while lower Token Limits (e.g., 1000) yield lower Scores (0–2). The vertical red stripe at `Token Limit = 28000` highlights a critical threshold for maximum performance.