## Diagram: Convolutional Neural Network (CNN) Architecture
### Overview
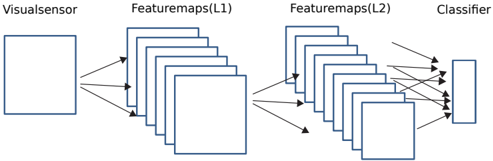
The image depicts a simplified block diagram of a Convolutional Neural Network (CNN) architecture. It illustrates the flow of data from a visual sensor through two layers of feature maps and finally into a classifier.
### Components/Axes
* **Visualsensor:** Represents the input layer, likely an image or video feed.
* **Featuremaps(L1):** Represents the first layer of feature maps, consisting of multiple feature detectors.
* **Featuremaps(L2):** Represents the second layer of feature maps, further processing the features extracted in L1.
* **Classifier:** Represents the final layer, responsible for classifying the input based on the extracted features.
### Detailed Analysis
The diagram shows the following components and their connections:
1. **Visualsensor:** A rectangular block on the left, labeled "Visualsensor." Three arrows originate from this block, pointing towards the "Featuremaps(L1)" block.
2. **Featuremaps(L1):** A set of five stacked rectangular blocks, labeled "Featuremaps(L1)." Three arrows originate from the "Visualsensor" and connect to the individual blocks within "Featuremaps(L1)." Three arrows originate from this block, pointing towards the "Featuremaps(L2)" block.
3. **Featuremaps(L2):** A set of five stacked rectangular blocks, labeled "Featuremaps(L2)." Three arrows originate from the "Featuremaps(L1)" and connect to the individual blocks within "Featuremaps(L2)." Multiple arrows originate from this block, pointing towards the "Classifier" block.
4. **Classifier:** A rectangular block on the right, labeled "Classifier." Multiple arrows originate from the "Featuremaps(L2)" and connect to the "Classifier" block.
### Key Observations
* The diagram illustrates a feedforward network, where data flows from left to right.
* The number of feature maps in each layer is not explicitly specified, but the diagram shows five feature maps in both L1 and L2.
* The connections between the feature maps and the classifier are dense, with multiple arrows indicating that each feature map contributes to the classification process.
### Interpretation
The diagram represents a basic CNN architecture, demonstrating how a visual input is processed through multiple layers of feature extraction before being classified. The "Visualsensor" captures the initial input, which is then processed by the "Featuremaps(L1)" layer to extract basic features. These features are further refined by the "Featuremaps(L2)" layer, and finally, the "Classifier" uses these refined features to make a prediction or classification. The multiple arrows between layers suggest that each layer's output contributes to the subsequent layer's processing, allowing the network to learn complex patterns and relationships in the data.