\n
## Diagram: Convolutional Neural Network Architecture
### Overview
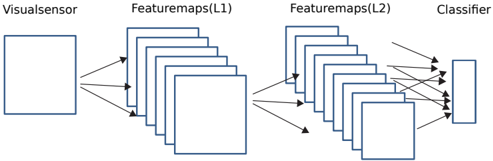
The image depicts a simplified diagram of a convolutional neural network (CNN) architecture. It illustrates the flow of information from a visual sensor through multiple layers of feature maps to a classifier. The diagram shows the progression of data through layers labeled "Visualsensor", "Featuremaps(L1)", "Featuremaps(L2)", and "Classifier".
### Components/Axes
The diagram consists of four main components, arranged horizontally from left to right:
1. **Visualsensor:** Represented by a single square.
2. **Featuremaps(L1):** A group of approximately six square blocks, stacked together.
3. **Featuremaps(L2):** A larger group of approximately twelve square blocks, also stacked.
4. **Classifier:** Represented by a single rectangular block.
Arrows indicate the flow of data between these components. The labels are positioned directly above each component. There are no axes or scales present in this diagram.
### Detailed Analysis or Content Details
The diagram illustrates a feedforward network.
* **Visualsensor:** The input to the network. No specific details are provided about the sensor itself.
* **Featuremaps(L1):** The first layer of feature maps. The visual sensor's output is connected to each of the six blocks in this layer via arrows.
* **Featuremaps(L2):** The second layer of feature maps. Each of the six blocks in Featuremaps(L1) is connected to multiple blocks in Featuremaps(L2). There are approximately twelve blocks in this layer. The connections are not fully connected; each block in L1 connects to several blocks in L2.
* **Classifier:** The final layer, which receives input from all blocks in Featuremaps(L2). The arrows indicate that each block in L2 is connected to the classifier.
The diagram does not provide any numerical data or specific parameters of the network. It is a high-level representation of the architecture.
### Key Observations
The diagram highlights the increasing number of feature maps as the data progresses through the network. This suggests that the network is learning increasingly complex features. The connections between layers are not fully connected, which is typical of convolutional neural networks.
### Interpretation
This diagram illustrates the core concept of a CNN: extracting hierarchical features from input data. The visual sensor provides the initial input, which is then processed through multiple layers of feature maps. Each layer learns to detect different features, and the complexity of these features increases with depth. The final layer, the classifier, uses these learned features to make a prediction. The diagram emphasizes the layered structure and the flow of information, but it does not provide details about the specific operations performed in each layer (e.g., convolution, pooling, activation functions). The diagram is a conceptual representation and does not contain factual data. It serves to illustrate the general architecture of a CNN.