## Diagram: Convolutional Neural Network (CNN) Architecture
### Overview
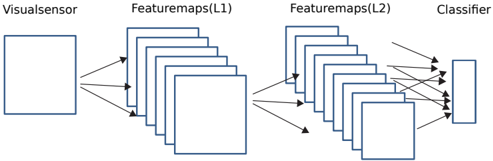
The image is a schematic diagram illustrating the architecture of a Convolutional Neural Network (CNN), a type of deep learning model commonly used for processing visual data. It depicts the flow of information from an input source through successive layers of feature extraction to a final classification output. The diagram is composed of labeled blocks and directional arrows indicating data flow.
### Components/Axes
The diagram is organized horizontally into four distinct, labeled sections from left to right:
1. **Visualsensor**: A single, large square box positioned on the far left. This represents the input layer of the network, which receives raw visual data (e.g., an image).
2. **Featuremaps(L1)**: A stack of multiple, overlapping square boxes located to the right of the "Visualsensor." The label "L1" indicates this is the first layer of feature extraction. The stacking visually represents multiple feature maps (or channels) generated by convolutional filters.
3. **Featuremaps(L2)**: A second, larger stack of overlapping square boxes positioned to the right of "Featuremaps(L1)." The label "L2" denotes a deeper, second layer of feature extraction. This stack contains more individual squares than the L1 stack, suggesting an increase in the number of feature maps in deeper network layers.
4. **Classifier**: A single, tall, narrow vertical rectangle located on the far right. This represents the final classification head of the network, typically composed of fully connected (dense) layers that output a prediction (e.g., a class label).
**Flow and Connections:**
* **Directional Arrows**: Black arrows explicitly show the forward propagation of data.
* Two arrows originate from the right side of the "Visualsensor" box and point to the left side of the "Featuremaps(L1)" stack.
* Two arrows originate from the right side of the "Featuremaps(L1)" stack and point to the left side of the "Featuremaps(L2)" stack.
* Multiple arrows (approximately five) originate from various points on the right side of the "Featuremaps(L2)" stack and converge on the left side of the "Classifier" rectangle. This illustrates the flattening or pooling of spatial features into a vector for classification.
### Detailed Analysis
* **Spatial Progression**: The diagram shows a clear left-to-right spatial progression: Input → Low-level Features (L1) → Higher-level Features (L2) → Output Decision.
* **Layer Complexity**: The visual complexity increases from left to middle. The single input box branches into multiple feature maps in L1, which then branch into an even greater number of feature maps in L2. This is a standard pattern in CNNs where deeper layers learn more complex and numerous features.
* **Dimensionality Reduction**: The final transition from the spatially arranged "Featuremaps(L2)" to the one-dimensional "Classifier" block implies an operation that reduces spatial dimensions (e.g., flattening or global pooling) to prepare the data for the dense classification layers.
### Key Observations
1. **Standard CNN Pattern**: The diagram follows the canonical structure of a simple CNN: an input layer, one or more convolutional/pooling layers (represented by the feature map stacks), and a final classifier.
2. **Increasing Depth**: The "Featuremaps(L2)" stack is visually denser (contains more overlapping squares) than the "Featuremaps(L1)" stack. This accurately reflects the common design practice where the number of filters (and thus feature maps) increases in deeper layers to capture more abstract features.
3. **Many-to-One Connection**: The multiple arrows from "Featuremaps(L2)" to the single "Classifier" block are a key visual metaphor for how spatial information is aggregated and transformed into a non-spatial representation for final decision-making.
### Interpretation
This diagram serves as a high-level, conceptual blueprint for a visual recognition system. It abstracts away specific mathematical operations (like convolution, ReLU activation, or pooling) to focus on the architectural flow and the transformation of data representation.
* **What it demonstrates**: The core principle of hierarchical feature learning. The "Visualsensor" provides raw pixels. "Featuremaps(L1)" likely learns simple, low-level patterns like edges and textures. "Featuremaps(L2)" combines these to detect more complex shapes and parts of objects. The "Classifier" then interprets these high-level features to assign a label (e.g., "cat," "car").
* **Relationships**: The arrows define a strict, feed-forward dependency. The output of one stage is the sole input to the next. The classifier is entirely dependent on the features extracted by the preceding convolutional layers.
* **Notable Absence**: The diagram does not show any feedback loops, skip connections (as in ResNets), or parallel branches (as in Inception networks), indicating it represents a simple, sequential CNN architecture. There are no numerical values, so no quantitative trends or outliers can be extracted. The information is purely structural and relational.