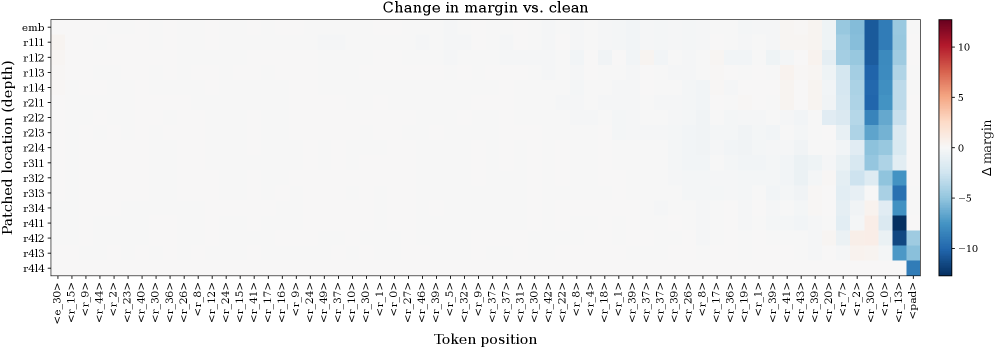
## Heatmap: Change in margin vs. clean
### Overview
The image is a heatmap visualizing the change in margin (Δ margin) across different token positions and patched locations in a model. The x-axis represents token positions (e.g., `<r_30>`, `<r_15>`, `<pad>`), while the y-axis represents patched locations (e.g., `emb`, `r11`, `r12`, ..., `r44`). The color scale ranges from -10 (dark blue) to +10 (dark red), with white indicating no change.
### Components/Axes
- **X-axis (Token position)**: Categories include `<r_30>`, `<r_15>`, `<r_44>`, `<r_2>`, `<r_5>`, `<r_9>`, `<r_10>`, `<r_1>`, `<r_0>`, `<r_37>`, `<r_24>`, `<r_8>`, `<r_17>`, `<r_18>`, `<r_19>`, `<r_20>`, `<r_21>`, `<r_22>`, `<r_23>`, `<r_25>`, `<r_26>`, `<r_27>`, `<r_28>`, `<r_29>`, `<r_31>`, `<r_32>`, `<r_33>`, `<r_34>`, `<r_35>`, `<r_36>`, `<r_38>`, `<r_39>`, `<r_40>`, `<r_41>`, `<r_42>`, `<r_43>`, `<r_13>`, `<r_7>`, `<r_0>`, `<r_1>`, `<r_2>`, `<r_3>`, `<r_4>`, `<r_5>`, `<r_6>`, `<r_7>`, `<r_8>`, `<r_9>`, `<r_10>`, `<r_11>`, `<r_12>`, `<r_13>`, `<r_14>`, `<r_15>`, `<r_16>`, `<r_17>`, `<r_18>`, `<r_19>`, `<r_20>`, `<r_21>`, `<r_22>`, `<r_23>`, `<r_24>`, `<r_25>`, `<r_26>`, `<r_27>`, `<r_28>`, `<r_29>`, `<r_30>`, `<r_31>`, `<r_32>`, `<r_33>`, `<r_34>`, `<r_35>`, `<r_36>`, `<r_37>`, `<r_38>`, `<r_39>`, `<r_40>`, `<r_41>`, `<r_42>`, `<r_43>`, `<r_44>`, `<pad>`.
- **Y-axis (Patched location (depth))**: Categories include `emb`, `r11`, `r12`, `r13`, `r14`, `r21`, `r22`, `r23`, `r24`, `r31`, `r32`, `r33`, `r34`, `r41`, `r42`, `r43`, `r44`.
- **Legend**: A color bar labeled "Δ margin" with values from -10 (dark blue) to +10 (dark red). White represents 0 change.
### Detailed Analysis
- **Token position `<pad>`**: The rightmost column shows significant variation. Values range from -10 (dark blue) in `r11`, `r12`, `r13`, `r14` to +10 (dark red) in `r41`, `r42`, `r43`, `r44`.
- **Other token positions**: Most positions (e.g., `<r_30>`, `<r_15>`, `<r_44>`) show minimal change (white), with occasional faint blue or red squares indicating small deviations (e.g., ±2–5).
- **Patched locations**: The `emb` layer (top row) shows no change for most tokens. Significant changes are concentrated in `r11`–`r14` and `r41`–`r44` for the `<pad>` token.
### Key Observations
1. The `<pad>` token exhibits the largest margin changes, with negative values in lower patched locations (`r11`–`r14`) and positive values in upper locations (`r41`–`r44`).
2. Other tokens show negligible changes, suggesting the model’s margin stability is primarily affected by padding tokens.
3. The `emb` layer remains unaffected across all token positions.
### Interpretation
The heatmap indicates that padding tokens (`<pad>`) disproportionately influence margin changes, particularly in deeper patched layers (`r11`–`r14` and `r41`–`r44`). This suggests that padding token handling in the model may introduce variability in these layers, while other tokens and the embedding layer remain stable. The negative values in lower layers (`r11`–`r14`) could imply margin degradation, whereas positive values in upper layers (`r41`–`r44`) might reflect compensatory adjustments. This pattern highlights the importance of padding token management in maintaining model performance.