## Trajectory Plots: Six Variations
### Overview
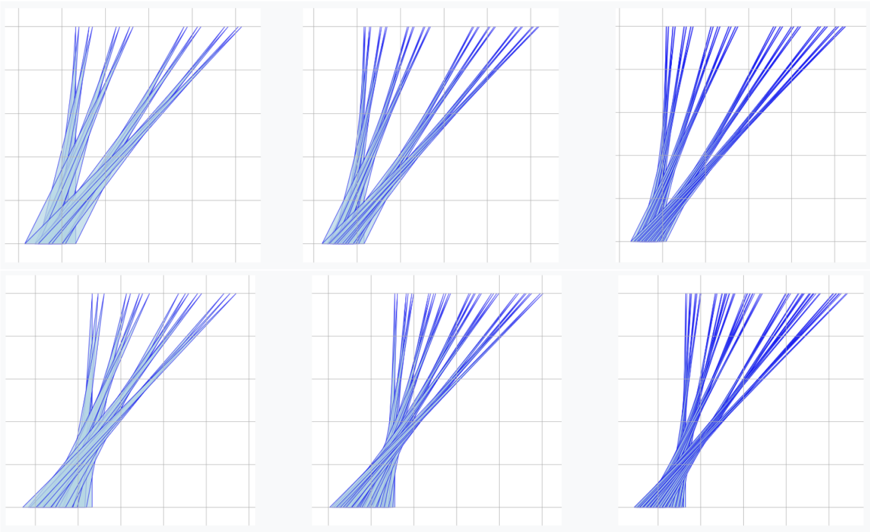
The image presents six separate trajectory plots arranged in a 2x3 grid. Each plot displays multiple blue lines originating from a common area at the bottom and diverging upwards. The plots are displayed on a grid.
### Components/Axes
Each plot has a grid background, with horizontal and vertical lines. There are no explicit axis labels or numerical scales. The plots appear to be normalized, with the origin at the bottom and the trajectories moving upwards.
### Detailed Analysis
Each of the six plots contains a set of trajectories, all starting from a similar point at the bottom of the plot and diverging upwards. The trajectories are represented by blue lines. The plots differ in the degree of divergence and the overall shape of the trajectories.
* **Top-Left Plot:** The trajectories start close together and diverge gradually as they move upwards.
* **Top-Middle Plot:** The trajectories start close together and diverge gradually as they move upwards.
* **Top-Right Plot:** The trajectories start close together and diverge gradually as they move upwards.
* **Bottom-Left Plot:** The trajectories start close together and diverge gradually as they move upwards.
* **Bottom-Middle Plot:** The trajectories start close together and diverge gradually as they move upwards.
* **Bottom-Right Plot:** The trajectories start close together and diverge gradually as they move upwards.
### Key Observations
The key observation is the variation in the divergence patterns across the six plots. While all trajectories originate from a similar point and move upwards, the rate and manner in which they spread out differ significantly.
### Interpretation
The image likely represents different scenarios or simulations where the initial conditions are similar, but the subsequent behavior diverges. The plots could represent anything from particle trajectories in a force field to the spread of information in a network, where the variations in divergence reflect different underlying parameters or conditions. The absence of axis labels makes it difficult to determine the specific context, but the visual patterns suggest a system where small initial differences can lead to significant variations in outcome.