## Line Flow Visualization: Unlabeled Grid Panels
### Overview
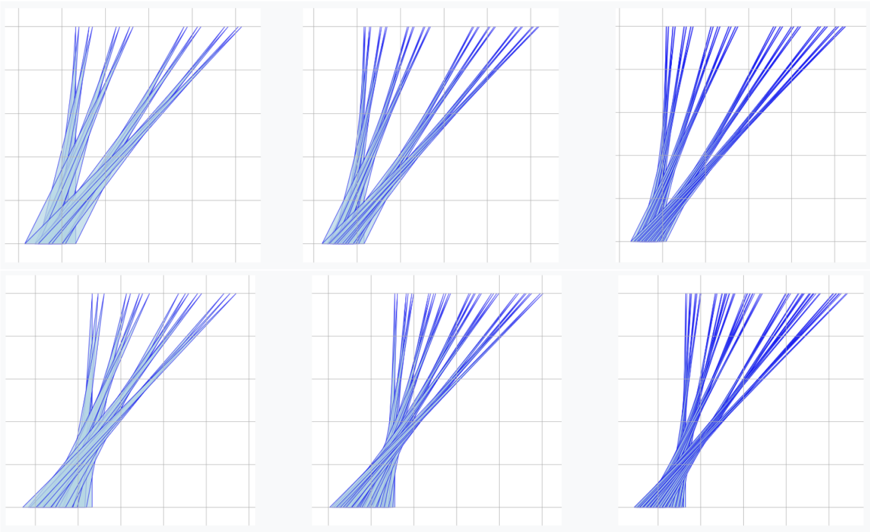
The image consists of six identical-sized panels arranged in a 2x3 grid. Each panel contains a set of blue lines originating from the bottom-left corner and extending toward the top-right, with varying density and directional patterns. No textual labels, legends, or axis markers are present.
### Components/Axes
- **Grid Structure**: All panels share a uniform white grid with black horizontal and vertical lines.
- **Line Characteristics**:
- Color: Blue (varying shades from light to dark).
- Origin: All lines begin at the bottom-left corner of each panel.
- Termination: Lines extend toward the top-right, with some curving or overlapping.
- **Absence of Labels**: No axis titles, legends, or textual annotations are visible.
### Detailed Analysis
1. **Panel 1 (Top-Left)**:
- Sparse line density.
- Lines spread out evenly, forming a gentle upward-right trajectory.
2. **Panel 2 (Top-Center)**:
- Moderate line density.
- Lines cluster more tightly, with slight curvature toward the center-right.
3. **Panel 3 (Top-Right)**:
- High line density.
- Lines overlap significantly, creating a "fan" effect with minimal curvature.
4. **Panel 4 (Bottom-Left)**:
- Moderate density with increased curvature.
- Lines exhibit a slight inward bend toward the center-left.
5. **Panel 5 (Bottom-Center)**:
- High density with pronounced twisting.
- Lines cross over each other, forming a braided pattern near the bottom-right.
6. **Panel 6 (Bottom-Right)**:
- Extremely high density.
- Lines twist sharply, creating a vortex-like effect at the bottom-right corner.
### Key Observations
- **Density Gradient**: Line density increases from top-left to bottom-right across the grid.
- **Directional Variation**: Lines in the bottom panels show more curvature and twisting compared to the top panels.
- **No Numerical Data**: No quantifiable values, categories, or legends are present to contextualize the visualization.
### Interpretation
The absence of labels and legends prevents direct interpretation of the data’s purpose. However, the visual patterns suggest a simulation of flow dynamics, such as:
- **Particle Movement**: Lines could represent trajectories of particles in a fluid or gas, with density indicating concentration.
- **Network Flow**: The twisting patterns might symbolize data packet routing in a network, with congestion in denser regions.
- **Artistic Representation**: The design could be abstract, emphasizing aesthetic progression rather than factual data.
**Critical Limitation**: Without textual context, the image’s intent remains speculative. The visualization prioritizes visual storytelling over empirical data, making it unsuitable for technical analysis requiring precise metrics.