\n
## Pie Charts: Building Energy Use 1990 & 2000
### Overview
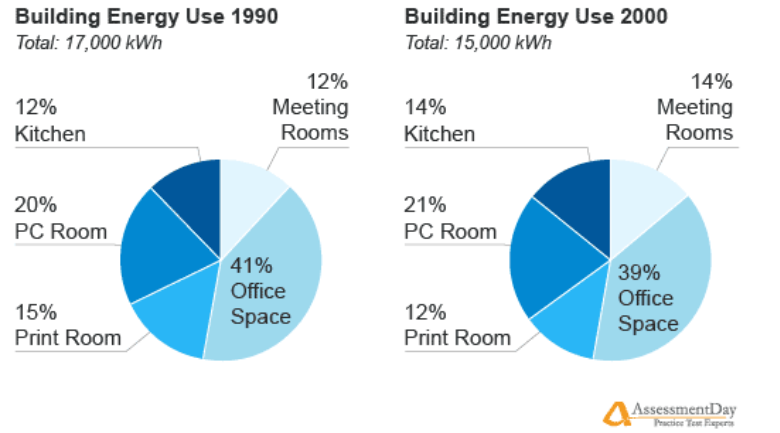
The image presents two pie charts comparing building energy use in 1990 and 2000. Each chart displays the percentage of total energy consumed by different areas within the building: Kitchen, Meeting Rooms, PC Room, Print Room, and Office Space. Total energy consumption is provided for each year.
### Components/Axes
Each chart consists of a circular pie divided into segments representing different areas of the building. Each segment is labeled with the area name and its corresponding percentage of total energy use.
* **1990 Chart:** Total energy use is 17,000 kWh.
* **2000 Chart:** Total energy use is 15,000 kWh.
The pie charts are positioned side-by-side. A logo "AssessmentDay Practice Test Experts" is present in the bottom-right corner.
### Detailed Analysis or Content Details
**1990 Energy Use:**
* **Office Space:** 41%
* **PC Room:** 20%
* **Print Room:** 15%
* **Kitchen:** 12%
* **Meeting Rooms:** 12%
**2000 Energy Use:**
* **Office Space:** 39% (slight decrease from 1990)
* **PC Room:** 21% (increase from 1990)
* **Print Room:** 12% (no change from 1990)
* **Kitchen:** 14% (increase from 1990)
* **Meeting Rooms:** 14% (increase from 1990)
### Key Observations
* Total energy consumption decreased from 17,000 kWh in 1990 to 15,000 kWh in 2000.
* Office Space remains the largest energy consumer in both years, but its percentage decreased slightly.
* PC Room energy consumption increased from 20% to 21%.
* Kitchen, Meeting Rooms, and Print Room all experienced changes in their percentage of total energy use.
### Interpretation
The data suggests that energy efficiency improvements were made between 1990 and 2000, resulting in a 13% reduction in overall energy consumption. While Office Space remains the dominant energy user, the decrease in its percentage suggests that energy-saving measures were likely implemented in that area. The increase in PC Room energy consumption could be due to increased computer usage or less efficient equipment. The changes in Kitchen and Meeting Rooms energy use could be attributed to changes in usage patterns or equipment upgrades. The data highlights a shift in energy consumption patterns within the building over the decade, indicating a potential focus on energy management and conservation. The logo "AssessmentDay Practice Test Experts" suggests this is a test question or example.