## Pie Charts: Building Energy Use Comparison (1990 vs. 2000)
### Overview
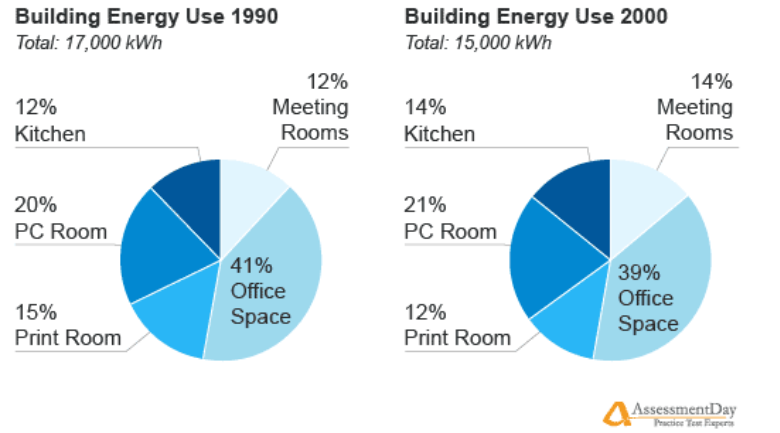
Two pie charts compare energy consumption across building spaces in 1990 and 2000. The 1990 chart shows a total of 17,000 kWh, while the 2000 chart totals 15,000 kWh. Both charts categorize energy use into five segments: Meeting Rooms, Kitchen, PC Room, Print Room, and Office Space.
### Components/Axes
#### 1990 Chart
- **Total Energy Use**: 17,000 kWh
- **Segments**:
- Meeting Rooms: 12% (dark blue)
- Kitchen: 12% (dark blue)
- PC Room: 20% (medium blue)
- Print Room: 15% (light blue)
- Office Space: 41% (lightest blue)
#### 2000 Chart
- **Total Energy Use**: 15,000 kWh
- **Segments**:
- Meeting Rooms: 14% (dark blue)
- Kitchen: 14% (dark blue)
- PC Room: 21% (medium blue)
- Print Room: 12% (light blue)
- Office Space: 39% (lightest blue)
### Detailed Analysis
#### 1990 Data
- **Meeting Rooms**: 12% of 17,000 kWh = **2,040 kWh**
- **Kitchen**: 12% of 17,000 kWh = **2,040 kWh**
- **PC Room**: 20% of 17,000 kWh = **3,400 kWh**
- **Print Room**: 15% of 17,000 kWh = **2,550 kWh**
- **Office Space**: 41% of 17,000 kWh = **6,970 kWh**
#### 2000 Data
- **Meeting Rooms**: 14% of 15,000 kWh = **2,100 kWh**
- **Kitchen**: 14% of 15,000 kWh = **2,100 kWh**
- **PC Room**: 21% of 15,000 kWh = **3,150 kWh**
- **Print Room**: 12% of 15,000 kWh = **1,800 kWh**
- **Office Space**: 39% of 15,000 kWh = **5,850 kWh**
### Key Observations
1. **Office Space Dominance**: Office Space consumed the largest share in both years (41% in 1990, 39% in 2000), though its share decreased slightly.
2. **Meeting Rooms Growth**: Meeting Rooms increased from 12% to 14%, reflecting a 3.1% rise in energy use despite a 12% drop in total energy.
3. **Print Room Decline**: Print Room energy use dropped from 15% to 12%, a 20% reduction in its share.
4. **PC Room Stability**: PC Room energy use remained relatively stable (20% to 21%), despite a 12% total energy reduction.
5. **Total Energy Reduction**: Total energy use fell by 11.8% (17,000 kWh to 15,000 kWh), suggesting improved efficiency.
### Interpretation
The data indicates a shift in energy consumption patterns over the decade. While Office Space remained the largest consumer, its relative share decreased, possibly due to energy-efficient technologies or reduced occupancy. Meeting Rooms and PC Rooms saw proportional increases, suggesting greater reliance on collaborative spaces and computing infrastructure. The 11.8% total energy reduction aligns with broader trends in building efficiency, though the reasons for Print Room’s decline (e.g., digitalization) are not explicitly stated. The consistent growth in Meeting Rooms and PC Rooms highlights evolving workplace dynamics.
### Footer Note
The charts include a watermark for "AssessmentDay Practice Test Experts," indicating the source of the data visualization.