## Line Graph: Accuracy vs. # Operations (In-Domain vs. Out-of-Domain)
### Overview
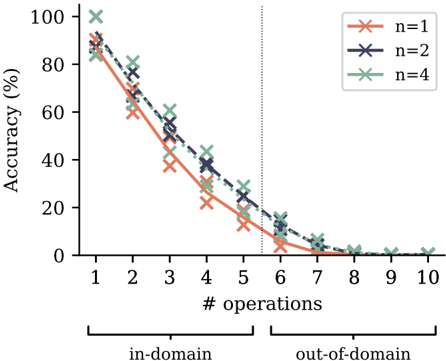
The graph illustrates the relationship between the number of operations performed and accuracy (%) for three distinct scenarios (n=1, n=2, n=4). It visually separates "in-domain" (operations 1–5) and "out-of-domain" (operations 6–10) performance using a vertical dashed line at x=6. Accuracy declines consistently across all scenarios as operations increase, with steeper drops observed in the out-of-domain region.
### Components/Axes
- **Y-Axis**: Accuracy (%) ranging from 0 to 100 in 20% increments.
- **X-Axis**: Number of operations (1–10), with a break between 5 and 6 to denote in-domain/out-of-domain separation.
- **Legend**: Located in the top-right corner, mapping:
- Red crosses (`✖️`) to **n=1**
- Blue stars (`★`) to **n=2**
- Green plus signs (`➕`) to **n=4**
- **Key Visual Elements**:
- Vertical dashed line at x=6 (in-domain/out-of-domain boundary).
- Data points connected by dashed lines for trend visualization.
### Detailed Analysis
1. **n=1 (Red Crosses)**:
- **In-Domain (1–5 operations)**: Starts at ~90% accuracy at 1 operation, declining to ~30% at 5 operations.
- **Out-of-Domain (6–10 operations)**: Drops further to ~10% at 10 operations.
- **Trend**: Steady linear decline in both regions.
2. **n=2 (Blue Stars)**:
- **In-Domain**: Begins at ~85% accuracy at 1 operation, falling to ~20% at 5 operations.
- **Out-of-Domain**: Reaches ~5% at 10 operations.
- **Trend**: Slightly steeper decline than n=1, with sharper drops post-x=6.
3. **n=4 (Green Plus Signs)**:
- **In-Domain**: Starts at ~80% accuracy at 1 operation, decreasing to ~10% at 5 operations.
- **Out-of-Domain**: Plummets to near 0% by 10 operations.
- **Trend**: Most pronounced decline, especially in out-of-domain.
### Key Observations
- **Universal Decline**: All scenarios show reduced accuracy as operations increase, regardless of domain.
- **Out-of-Domain Sensitivity**: Accuracy drops more sharply after x=6, with n=4 experiencing the steepest decline.
- **Marker Consistency**: Legend colors and symbols align perfectly with data series (e.g., red crosses for n=1).
- **Breakpoint Clarity**: The x-axis break at 5–6 visually reinforces the domain shift.
### Interpretation
The data suggests that **operational complexity (higher n)** correlates with reduced model performance, particularly in out-of-domain scenarios. For example:
- **n=4** (most complex) achieves only ~10% accuracy in out-of-domain at 10 operations, compared to ~30% for n=1.
- The **domain shift** exacerbates performance degradation, with out-of-domain accuracy being 50–70% lower than in-domain for equivalent n values.
- The linear trends imply a predictable trade-off between operational complexity and accuracy, highlighting potential limitations in generalizing models to unseen tasks.
This graph underscores the importance of domain alignment and operational simplicity in maintaining high accuracy, with implications for model design and deployment strategies.