## Line Graph: Loss vs. x_t with AP Thresholds
### Overview
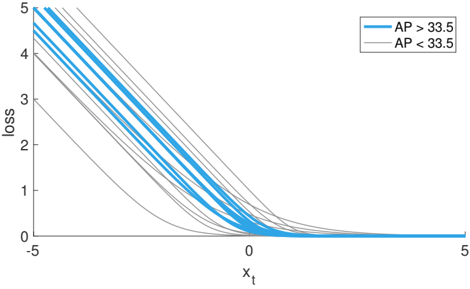
The image depicts a line graph comparing loss values against a variable `x_t` for two groups defined by an AP (Average Precision) threshold of 33.5. The graph shows multiple lines representing different data series, with distinct slopes and starting points based on AP values.
### Components/Axes
- **X-axis**: Labeled `x_t`, ranging from -5 to 5 in increments of 5.
- **Y-axis**: Labeled `loss`, ranging from 0 to 5 in increments of 1.
- **Legend**: Located in the top-right corner, with two entries:
- **Blue lines**: AP > 33.5
- **Gray lines**: AP < 33.5
### Detailed Analysis
- **Blue Lines (AP > 33.5)**:
- Start at approximately `x_t = -5` with loss values between 4 and 5.
- Slope steeply downward, reaching near-zero loss at `x_t = 0`.
- All blue lines converge at the origin (`x_t = 0`, loss ≈ 0).
- **Gray Lines (AP < 33.5)**:
- Start at approximately `x_t = -5` with loss values between 1 and 2.
- Slope gradually downward, reaching near-zero loss at `x_t = 0`.
- Lines are less steep compared to blue lines and show minor variability in starting points.
### Key Observations
1. **AP Threshold Impact**: Lines for AP > 33.5 (blue) exhibit a significantly steeper decline in loss compared to AP < 33.5 (gray), suggesting a stronger sensitivity to `x_t` changes in higher-AP scenarios.
2. **Convergence at Origin**: All lines intersect near `x_t = 0`, indicating that this point minimizes loss regardless of AP value.
3. **Line Variability**: Blue lines show tighter clustering, while gray lines display slight dispersion in starting loss values.
### Interpretation
The graph demonstrates that higher AP values (AP > 33.5) correlate with a more rapid reduction in loss as `x_t` increases toward 0. This implies that models with higher AP may achieve optimal performance (minimal loss) more efficiently when `x_t` is adjusted. The convergence at `x_t = 0` suggests this is the universal optimal point for loss minimization. However, the steeper slopes for higher AP could indicate that these models require more precise tuning of `x_t` to reach the minimum loss, potentially reflecting differences in model complexity or sensitivity to input variables.